Importing interpretations
Create an interpretation on your local computer using the Analysis App window and then import the interpretation into AX Server as part of a packaged analysis app (.aclapp file). When the interpretation's source table is updated by analytics running on AX Server, the interpretation dynamically updates to visualize the new data.
What do you need?
To complete this quick start, you need the following:
- an installation of AX Client with a working connection to an AX Server instance
- an installation of Analytics with the same edition (Unicode or non-Unicode) as your Analytics Exchange installation
- access to the sample data that comes with Analytics
Note
By default, the sample data projects are installed at C:\Users\username\Documents\ACL Data\Sample Data Files on your local file system.
The scenario
You are your organization's data visualization expert, and you need to create an interpretation for a specific table that other users can view in AX Web Client.
To do this, you use Analytics to open the project and then create the interpretation in the Analysis App window. Once you create the interpretation, you package the analysis app and import the package into AX Server so it is available for use with analytic results data.
Process
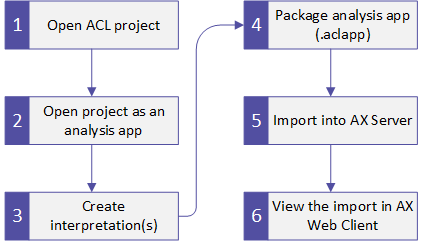
Open the Analytics project
Start by opening a project locally using Analytics and creating an analytic script:
- Open ACL for Windows.
- Click Open Analytic Project and from the ACL Data\Sample Data Files folder, select Sample Project.ACL.
-
From tree view, open Scripts\Calculate_Median_Value and add the following line inside the comment block on line 2 of the script editor and then save and close the script:
//ANALYTIC test
Note
The project requires at least one analytic script to be imported as an analysis app on AX Server. You use Scripts\Calculate_Median_Value to satisfy this requirement so that you can import the interpretation, however the functionality of the script is not part of this quick start.
The Analytic tag identifies the script as an analytic and is required before importing. Lines 1 to 10 of the script should look as follows:
Comment
//Analytic test
**   NOTICE:
**   ACL provides the attached script "as is" and free of charge.
**   ACL makes no warranties or representations with respect to
**   the script, including its quality or fitness for a particular
**   purpose. You understand and acknowledge that you assume all
**   risk of loss or damages which may arise from your use or
**   inability to use the script.
END - Explore the contents of the tree view to see the tables the project contains.
For this quick start, you will use the Ap_Trans table in the Table\Accounts_Payable folder to create an interpretation.
Open the project as an analysis app
Open the project as an analysis app in the Analysis App window so that you can create the interpretation.
In the Overview tab, right-click Sample Project.ACL and select Open as Analysis App.
The Analysis App window opens and displays the list of data tables.
Create the interpretation
Open the Ap_Trans table in the Visualizer and create the interpretation:
- In the Data Tables list, find Ap_Trans and click Open on that row.
- From the Table View, at the top of the table, click Add Visualization
 and select Line Chart.
 - In the Configure Visualization pane, set the following fields:
- X-Axis Invoice Date
- Y-Axis Sum of Invoice Amount
- In the top right-hand corner, click Save and then:
- In the Title field, enter import test.
- Click Save.
- Close the Analysis App window.
A new analysis app file called Sample Project.aclx is visible in the Windows folder that contains the Analytics project. This file stores the interpretation you created.
Package the analysis app
Now that the interpretation exists in the analysis app, you must package the analysis app so you can import it into AX Server:
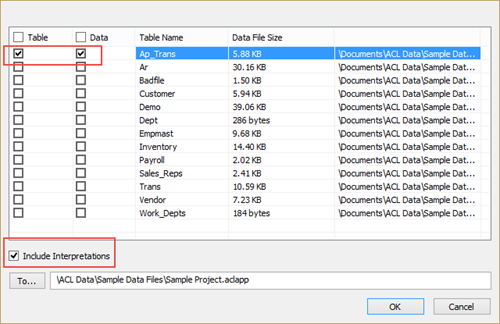
- In Analytics, on the Overview tab, right-click Sample Project.ACL and select Package Analysis App.
- In the Select Tables dialog box, find the Ap_Trans table and select Data and Table for that row.
-
At the bottom of the dialog box, select Include Interpretations.
Note
If you omit this step, the interpretation is not included in the packaged analysis app and is not imported into AX Server.
- Do not change the file name or file path in the To field.
The packaged analysis app must have the same location and file name as the project file (.acl) to include the interpretation.
-
Verify that the dialog is configured correctly and click OK.
A new packaged analysis app file called Sample Project.aclapp is visible in the Windows folder that contains the Analytics project. This file stores the interpretation you created and you can import it into AX Server.
Import the packaged analysis app
Create a destination folder in the Working directory of AX Server
Before you can import the packaged analysis app, you must create a destination collection and folder in the Working directory of AX Server:
- Open AX Client.
- In the Server Explorer, right-click the Working directory and select New > Collection.
Name the collection something meaningful.
- In the Server Explorer, right-click the new collection and select New > folder.
This folder is the target for your project import, so use a name that identifies the source Analytics project, such as Sample.
The packaged analysis app and destination folder both exist, so you can now import the interpretation into AX Server.
Import the packaged analysis app file into the destination folder
Now that the import is prepared and packaged, import the packaged analysis app:
- In AX Client, in the Server Explorer, right-click the folder you created and select Import.
- Browse to the ACL Data\Sample Data Files folder, select Sample Project.aclapp, and click Open.
- In the Select Import Destination dialog box, select Import source data files (.fil files) and click Import.
- Verify that the import succeeded by checking for the Sample Project in the Analysis Apps sub-folder and the Ap_Trans table in the Data sub-folder.
View the imported interpretation in AX Web Client
The import is complete and the data table is on AX Server with its associated interpretation. Now you can open the interpretation to verify that it is available:
- In your Web browser, open AX Web Client by navigating to https://<servername>/aclax.
- From the homepage, navigate to collectionName > folderName > Data Tables.
-
In the row for Ap_Trans, click Saved Interpretations
 .
.The list of saved interpretations expands and the import test interpretation that you imported appears.
- In the row for the interpretation, click Open.
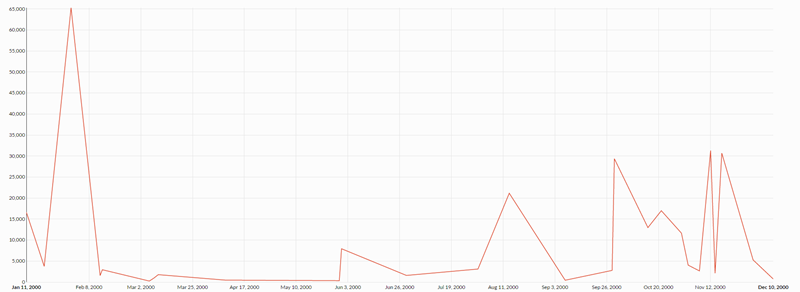
Result The interpretation opens in the Visualizer and you can see the line chart you created in the Analysis App window. Consumers of analytic results in your organization can now sign into AX Web Client and view this chart and see the latest visualized data for this table.