Using AX Web Client > Interpretations and Visualizations > Visualizing results data in charts > Summary table

Summary table

Summary tables group records on unique values in one or more key fields and then perform a count for the number of matching records. You can further drill into the summary by selecting a column and producing a crosstab. Once you define the summary, you can also select numeric fields to subtotal.

Tip

Summary tables most effective when you are comparing a limited number of categories.

When do you use it?

Frequency summaries

Select row key fields only and summarize tables to view the frequency of values across each unique combination of key fields.

Example

Vendor State Vendor Category Count
TX A 3
TX B 15
CA A 47
NY F 2

Cross-tabular summaries

Select row key fields as well as a column and create a crosstab that summarizes the relationship between two categorical variables by depicting the number of times each of the possible category combinations occurred in the data.

Example

Class rank Performance
<= 60% GPA 60% to 79% GPA >= 80% GPA
Freshman 32 60 15
Sophomore 25 70 23
Junior 40 60 10
Senior 15 45 30

Subtotals

Include values in the summary to find the sum of a numeric field for each of the possible category combinations in your data.

Data configuration settings

Setting Data types supported Description
Column All The field used to include a second categorical variable for cross-tabular results. You can add one column to the summary table and create a crosstab, or leave the field blank to perform a simple one-dimensional summary.
Rows All The fields used to group records. You can add between 0 and n rows and each record in the summary table represents a unique combination of the values from the selected fields.
Values Numeric

The calculation to perform on the summary table data:

  • Count the count of records within each group or crosstab cell in the summary table
  • numericField the sum of the selected numeric field for each group or crosstab cell in the summary table

You can add between 0 and n value fields to the summary table.

Example

You are performing an analysis of inventory data and you need to review information about unit costs and quantities for different vendors in your vendor list. You are also interested in seeing how these numbers break down across product class and vendor city.

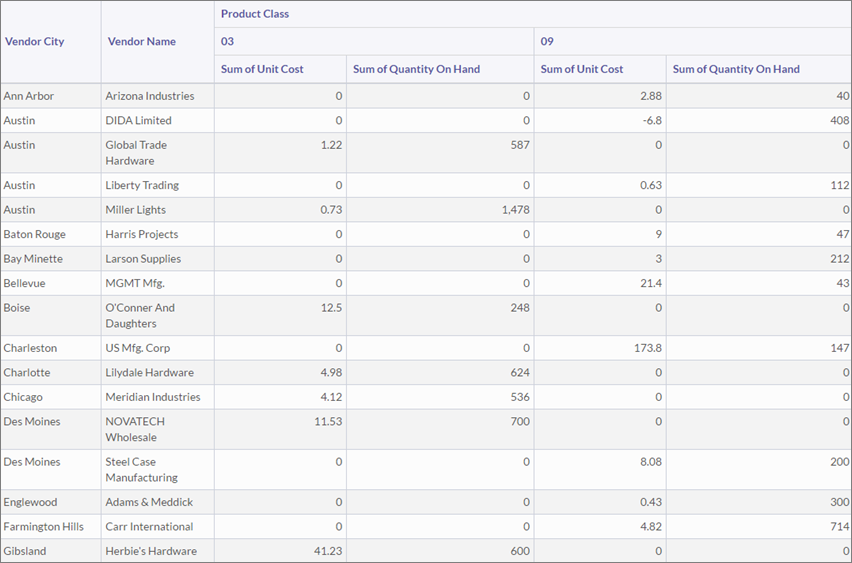
To capture this information in a single view, you create a summary table with the following settings:

The table summarizes the vendor data into the crosstab you defined and performs sum calculations for unit cost and quantity values: