Identifying outliers
Use the outlier feature in Analytics to identify records that are out of the ordinary and could require closer scrutiny.
What are outliers?
Outliers are records with numeric amounts that differ significantly from the numeric amounts in the records that they are grouped with.
Example of an outlier in a group
In an accounts payable file, invoices from a particular company typically range between $500 and $1,000. However, one invoice is for $8,500.
Note
A record can be an outlier for a legitimate reason. Typically, you need to perform additional examination of the outliers identified by Analytics to determine if any issues actually exist.
Grouping records is optional
When examining data for outliers, you do not have to group the records. You may be interested in finding outliers across an entire table, rather than within specific groups.
Example of outliers in an entire set of records
In an accounts payable file, the entire set of invoices typically ranges between $40 and $5,000. However, three invoices are greater than $20,000.
How are outliers identified?
For each group of records, or for an entire set of records, Analytics uses the standard deviation of a specified numeric field, or a multiple of the standard deviation, to establish upper and lower outlier boundaries.
Any record with a value in the numeric field that is greater than the upper boundary, or less than the lower boundary, is an outlier and included in the output results.
Standard deviation is a measure of the dispersion of a data set – that is, how spread out the values are. The outliers calculation uses population standard deviation.
Identifying outliers for a set of numbers
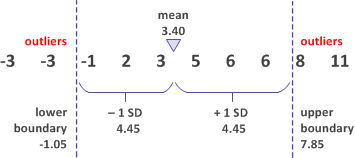
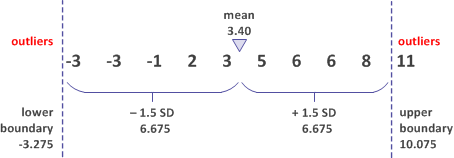
You want to identify any outliers in the following set of numbers:
-3, -3, -1, 2, 3, 5, 6, 6, 8, 11
The mean (average) of the numbers is 3.40. The mean is used to calculate the standard deviation (SD) of the set: 4.45.
The mean ± 1 standard deviation
In the first example, you use the mean ± 1 standard deviation to establish the upper and lower outlier boundaries. Four values are identified as outliers.

The mean ± 1.5 standard deviations
In the second example, you use the mean ± 1.5 standard deviations to establish the upper and lower outlier boundaries. Now only one value is identified as an outlier.

Positioning the outlier boundaries
You can position the outlier boundaries wherever you feel is appropriate, or you can test different positions and compare results.
To position the boundaries, you specify any positive multiple of the standard deviation of the outlier field: 0.5, 1, 1.5, and so on. For example, if you specify a multiple of 1.5, the outlier boundaries are 1.5 standard deviations above and below the mean or median of the values in the outlier field.
For the same set of data, as you increase the standard deviation multiple, you potentially decrease the number of outliers in the output results.
The distribution of data
The values in a set of numeric data are typically distributed over a range from smallest to largest. In a normal distribution, the values are evenly distributed around the center point of the data, forming a bell-shaped curve. The center point is often defined as the average or the mean of the values, but it could also be the median or the mode.
Standard deviation of a normal distribution
If you calculate the standard deviation for a set of normally distributed values, 68% of the values fall within one standard deviation of the mean (±), and 99.7% of the values fall within three standard deviations of the mean (±). Only a very few values exceed three standard deviations from the mean.
The distribution of values in the data sets that you analyze in Analytics may often be skewed rather than normally distributed. For example, a transaction file may have thousands of relatively small transactions, and a few large transactions. However, we can use a normal distribution for a simple illustration of how outlier boundaries work in Analytics.
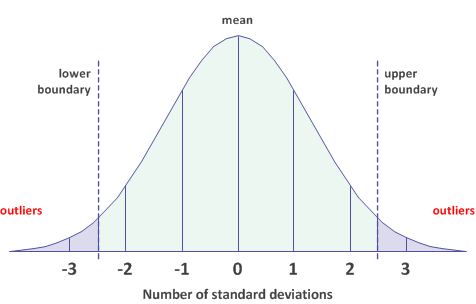
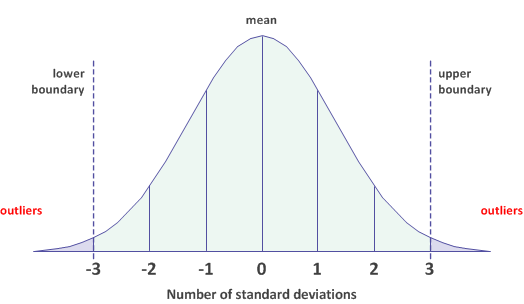
As the examples below show, increasing the standard deviation multiple moves the upper and lower outlier boundaries closer to the tails of the distribution curve. As the boundaries move closer to the tails, progressively fewer values occur outside the boundaries.
Outlier boundaries ±2.5 standard deviations from the mean
Values that are greater than +2.5 standard deviations from the mean, or less than -2.5 standard deviations, are included as outliers in the output results.

Outlier boundaries ±3 standard deviations from the mean
Values that are greater than +3 standard deviations from the mean, or less than -3 standard deviations, are included as outliers in the output results.

Guidelines
When you specify settings in the outliers feature, consider the nature of the data you are analyzing:
| Nature of the data | Setting guideline |
|---|---|
| Values are clustered, with a small range | Use a smaller standard deviation multiple. Try starting with 1. Use decimal multiples such as 1.25, to make precise adjustments. |
| Values are dispersed, with a large range | Use a larger standard deviation multiple. Try starting with 3. |
| The data is skewed, with a small percentage of the values being large, or small, when compared to the rest of the data | Use Median, instead of Average, as the method for calculating the center point of the values that you are examining. |
Adjusting based on the output results
- Too many results increase the standard deviation multiple
- Too few results, or no results reduce the standard deviation multiple
Keep in mind that you can use decimal multiples, and multiples less than 1. For example: 0.75.
Steps
- Open the table that you want to test for outliers.
- From the Analytics main menu, select Analyze > Outliers.
- Under Method, select the method for calculating the center point of the values in the numeric field that you are examining:
- Average
- Median
- In Number of times of S.dev, specify a multiple of the standard deviation to use for the outlier boundaries.
You can specify any positive integer or decimal numeral (0.5, 1, 1.5, 2 . . . ).
- Do one of the following:
- From the Primary
Keys list, select one or more key fields to use for grouping the records in the table.
Tip
You can Ctrl+click to select multiple non-adjacent fields, and Shift+click to select multiple adjacent fields.
- Select No Key to identify outliers across the entire table, rather than within specific groups.
- From the Primary
Keys list, select one or more key fields to use for grouping the records in the table.
- From the On Field list, select the numeric field to examine for outliers ("the outlier field").
- Optional. From the Other Fields list, select one or more additional fields to include in the output table.
Note
Key fields and the outlier field are automatically included in the output table, and do not need to be selected.
-
If there are records in the current view that you want to exclude from processing, enter a condition in the If text box, or click If to create an IF statement using the Expression Builder.
Note
The If condition is evaluated against only the records remaining in a table after any scope options have been applied (First, Next, While).
The IF statement considers all records in the view and filters out those that do not meet the specified condition.
- Do one of the following:
- In the To text box, specify the name of the output table.
- Select Screen to output the results to the Analytics display area.
- Deselect Presort, if appropriate.
Note
Guidance is provided below.
- On the More tab:
- Optional. To specify that only a subset of records are processed, select one of the options in the Scope panel.
- Optional. Select Use Output Table if you want the output table to open automatically.
- Click OK.
Outliers dialog box options
The tables below provide detailed information about the options in the Outliers dialog box.
Main tab
| Options – Outliers dialog box | Description | ||||||||||
|---|---|---|---|---|---|---|---|---|---|---|---|
| Average Median |
The method used for calculating the center point of the values in the outlier field.
The center point is used in calculating the standard deviation of the values in the outlier field. Note If you select Median, the outlier field must be sorted. Select Presort if the outlier field is not already sorted. Tip If the data you are examining for outliers is significantly skewed, Median might produce results that are more representative of the bulk of the data. |
||||||||||
| Number of times of S.dev | In the outlier field, the number of standard deviations from the mean or the median to the upper and lower outlier boundaries. You can specify any positive integer or decimal numeral (0.5, 1, 1.5, 2 . . . ) For example, specifying 2 establishes, for each key field group, or for the field as a whole:
Any value in the outlier field greater than an upper boundary, or less than a lower boundary, is included as an outlier in the output results. Note For the same set of data, as you increase the number of standard deviations, you potentially decrease the number of outliers in the output results. |
||||||||||
|
Primary Keys optional |
The field or fields to use for grouping the data in the table. For each key field group, a standard deviation is calculated for the group's numeric values in the outlier field. The group standard deviation is used as the basis for identifying group outliers. Key fields can be character, numeric, or datetime. Multiple fields can be any combination of data types. If you select more than one field, you created nested groups. The nesting follows the order in which you select the fields. Note The key field or fields must be sorted. Use Presort if one or more fields are not already sorted. |
||||||||||
|
No Key optional |
Do not group the data in the table. A standard deviation is calculated for the outlier field as a whole. The field standard deviation is used as the basis for identifying field outliers. |
||||||||||
|
On Field ("the outlier field") |
The numeric field to examine for outliers. You can examine only one field at a time. If you select a key field, outliers are identified at the group level. If you select No Key, outliers are identified at the field level. |
||||||||||
|
Other Fields optional |
One or more additional fields to include in the output. Note Key fields and the outlier field are automatically included in the output table, and do not need to be selected. |
||||||||||
|
If optional |
Allows you to create a condition to exclude records from processing. You can enter a condition in the If text box, or click If to create an IF statement using the Expression Builder. |
||||||||||
|
To optional |
Specifies the name and location of the output table.
Regardless of where you save the output table, it is added to the open project if it is not already in the project. If Analytics prefills a table name, you can accept the prefilled name, or change it. |
||||||||||
|
Screen optional |
Displays the results in the Analytics display area instead of creating an output table. | ||||||||||
|
Presort optional |
Performs a sorting operation before executing the command.
Tip If the appropriate field or fields in the input table are already sorted, you can save processing time by not selecting Presort. |
More tab
| Options – Outliers dialog box | Description |
|---|---|
| Scope panel | Specifies which records are processed:
Note The number of records specified in the First or Next options references either the physical or the indexed order of records in a table, and disregards any filtering or quick sorting applied to the view. However, results of analytical operations respect any filtering. If a view is quick sorted, Next behaves like First. |
| Use Output Table | Specifies whether the Analytics table containing the output results opens automatically upon completion of the operation. |
| OK | Executes the operation. If the overwrite prompt appears, select the appropriate option. |