Analytics user interface overview
The Analytics user interface includes a number of elements that display specific types of information, and allow you to work with data:
- The main Analytics user interface
- Command dialog boxes
- Additional user interface elements
- Data Definition Wizard
- Table Layout dialog box
- Expression Builder dialog box
- Dialog Builder
- The Analysis App window
Understanding the organization and function of the various user interface elements helps you work effectively with Analytics.
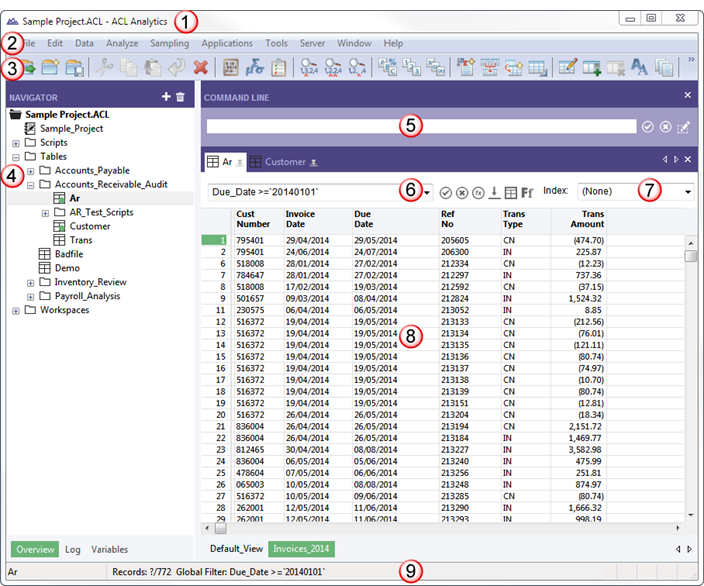
The main Analytics user interface
The main Analytics user interface appears automatically when you open Analytics.
|
Number |
Element |
Description |
|---|---|---|
|
1 |
Title Bar |
Displays the name of the open Analytics project, and the ACL for Windows component name. |
|
2 |
Main Menu |
Provides access to most Analytics features, including menu commands for:
|
|
3 |
Buttons in the toolbar are shortcuts to common actions. Analytics enables buttons that are relevant to your current activity. To display or to hide the toolbar, select . Note You can customize the buttons contained in the toolbar. For more information, see Customize the Analytics toolbar. |
|
|
4 |
Navigator |
Displays information in three tabs about the open Analytics project:
Tip
To resize the Navigator, drag the divider between the Navigator and the display area. You can also double-click the divider to close or open the Navigator. |
|
5 |
Allows you to enter ACLScript commands. To display or to hide the command line, select . |
|
|
6 |
Filter and Quick Search |
A text box and drop-down list that allow you to perform two different tasks:
|
|
7 |
Index |
Allows you to apply existing indexes to the table and to see if an index is currently applied |
|
8 |
Display Area |
Displays different types of information in the following tabs:
Tip
To resize the display area, drag the divider between the display area and the Navigator. You can also double-click the divider to close or open the Navigator. |
|
9 |
Status Bar |
Displays information such as:
|
Command dialog boxes
When you select an Analytics command such as Summarize or Duplicates from the main menu, a command dialog box opens. These dialog boxes contain options that allow you to specify:
- The input field or fields for the operation
- Various options that affect the behavior of the operation
- The format of the output results
Depending on the operation, the options are organized on two or three tabs in the dialog box:
- Main tab
- More tab, or Output tab, or both
The figures below show examples of the three tabs.
Note
The options in the dialog boxes vary somewhat depending on the operation you select. There are a number of standard options, explained below, that appear for most operations.
Options that are not standard are explained elsewhere in the Analytics Help.
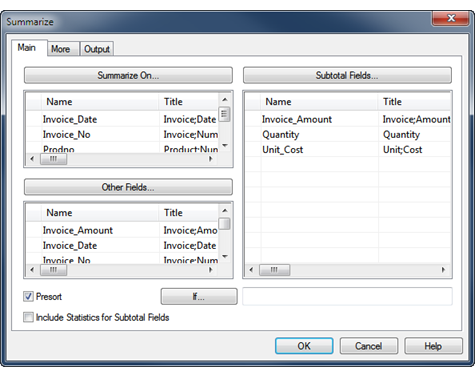
The Main tab
|
Main tab option |
Allows you to . . . |
|---|---|
|
field list or lists |
Specify the input field or fields for the operation |
|
Subtotal Fields |
Specify one or more numeric fields to optionally subtotal as part of the operation |
|
Presort |
Specify that the input field is automatically sorted before the operation is performed |
|
If |
Specify an IF statement that excludes records that do not meet the specified condition from the operation |
|
To (not shown) |
Specify the name and location of the Analytics table that will contain the output results Note Appears on the Output tab (as Name) in command dialog boxes that have an Output tab |
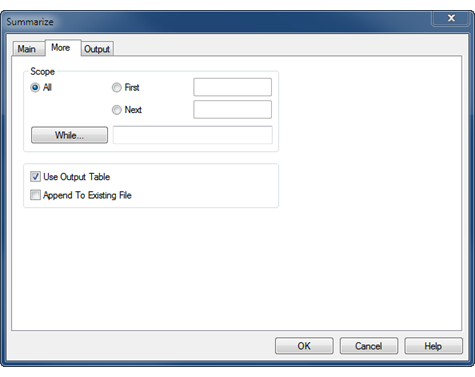
The More tab
|
More tab option |
Allows you to . . . |
|---|---|
|
Scope All | First | Next | While |
Specify how many records in a table are processed by an operation:
|
|
Use Output Table |
Specify that an Analytics table containing output results opens automatically upon completion of the operation Appears on either the Main tab or the More tab. |
|
Append To Existing File |
Specify that output results contained in an Analytics table or text file are added to the bottom of an existing Analytics table or text file |
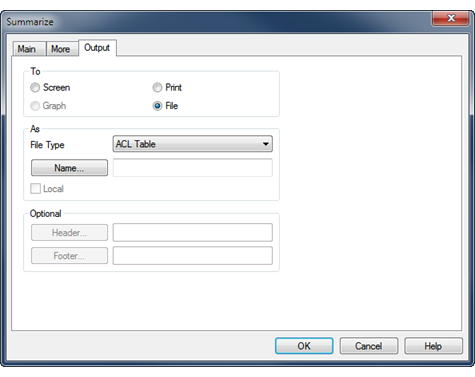
The Output tab
|
Output tab option |
Allows you to . . . |
|---|---|
|
To Screen | Print | Graph | File |
Specify the format of the output results:
Some operations do not support all four output formats |
|
File Type |
Specify an Analytics table or a text file when you save output results to a file Depending on the operation, you may be able to save to either a table or a text file, or to only one of these options |
|
Name |
Specify the name and location of the Analytics table or text file that will contain the output results Appears on the Main tab (as To) in command dialog boxes that do not have an Output tab |
|
Local |
Specify whether to save an Analytics table with output results locally or to the server (only enabled when connected to a server table) Appears on either the Main tab or the Output tab |
|
Header |
Specify a text header to accompany the output results Not supported for all format types |
|
Footer |
Specify a text footer to accompany the output results Not supported for all format types |
Additional user interface elements
Analytics also includes the following user interface elements, which are used to define and import data, work with tables, build expressions, insert custom dialog boxes into scripts, and work with analytics and analysis apps:
- Data Definition Wizard - a page-based wizard that provides a standard way to access a variety of data sources, mostly file-based
The Data Definition Wizard is automatically displayed when you create a new Analytics project, and when you add a new Analytics table to an existing project.
For more information, see Defining and importing data.
- Data Access window a visual interface that contains a number of data connectors you can use for accessing source data in either databases or files
For more information, see Defining and importing data.
- Table Layout dialog box – used to define or modify Analytics table
layouts
Table layouts specify how Analytics should identify records in the data source and read individual fields.
For more information, see Table Layout dialog box.
- Expression Builder dialog box – used to enter an expression
in Analytics
An expression is a statement that combines data fields, operators, functions, filters, and variables that Analytics evaluates and returns a value for.
For more information, see Expression Builder overview.
- Dialog Builder – used to create custom dialog boxes
in Analytics scripts
Custom dialog boxes provide user interaction or feedback when a script is running.
For more information, see Creating custom dialog boxes.
- The Analysis App window –
used to run analysis apps and create data interpretations
The Analysis App window is a freestanding component of Analytics that provides a simple user interface for running analytics, and bundled sets of analytics called analysis apps. It also provides advanced data interpretations and visualizations, giving users a number of options for reviewing the results of analysis.
For more information, see Working with analysis apps.