Concept Information
Aging groups the records in a table into aging periods based on values in a date or datetime field, and counts the number of records in each period.
Common uses of aging include evaluating sales trends, looking at transaction volumes, and grouping invoices by the number of days outstanding.
For example, you could age an accounts receivable table on the invoice date field to group records into 30-day periods – invoices from the cutoff date to 29 days previous, from 30 days previous to 59 days previous, and so on – and to find the total number of outstanding invoices for each period.
Note
You can age on datetime values, however only the date portion of the values is considered. The time portion is ignored. You cannot age on time data alone.
Subtotaling numeric fields
When aging, you can optionally subtotal one or more numeric fields. In the example above, you could subtotal the invoice amount field to find the total outstanding invoice amount for each aging period.
How aging periods work
Aging periods are based on date intervals (that is, number of days) measured backward in time from either:
- The current system date
- A cutoff date you specify such as a fiscal period end date
Specifying a single date interval of 30 creates an aging period that includes any dates 30 days prior to the cutoff date, or earlier.
Specifying multiple date intervals creates multiple aging periods. You can specify date intervals such as 0, 90, and 120 days as starting points for aging periods, or you can accept the default settings of 0, 30, 60, 90, 120, and 10,000 days.
An interval of 10,000 days, or an appropriate final interval you specify, is used to isolate records with dates that are probably invalid.
The table below shows how the cutoff date and the date intervals combine to create five aging periods, and the dates that are included in each period.
| Cutoff date | Date intervals | ||||
|---|---|---|---|---|---|
| 31 Dec 2016 | 0 | 30 | 60 | 90 | 120 |
| includes: 31 Dec 2016 to 02 Dec 2016 |
includes: 01 Dec 2016 to 02 Nov 2016 |
includes: 01 Nov 2016 to 03 Oct 2016 |
includes: 02 Oct 2016 to 02 Sep 2016 |
includes: 01 Sep 2016 to earliest date |
|
The Statistics option
The Include Statistics for Subtotal Fields option allows you to calculate average, minimum, and maximum values for each subtotaled numeric field. In the example above, using the statistics option would calculate the average, minimum, and maximum invoice amounts for each aging period.
Aging in detail
Aging performs the following operations:
|
Operation |
Location in Aging results |
|---|---|
|
Groups the records into aging periods based on cutoff date and date intervals |
Days field |
|
Counts (subtotals) the number of records in each aging period, and calculates the percentage of the total count represented by each subtotal |
Count field Percent of Count field |
|
Provides the minimum and maximum ages of records (that is, the most recent and the oldest) |
not shown |
|
Optionally subtotals the values of one or more numeric fields for each aging period, and for the first selected field calculates the percentage of the total value represented by each subtotal |
Trans Amount field Percent of Field field |
|
Optionally calculates average, minimum, and maximum values for each subtotaled numeric field |
not shown |
|
Provides totals for all numeric fields included in the output results |
Totals row |
|
Optionally breaks down the output results based on the values in a character field such as customer ID or transaction type (requires that the character field is sorted prior to aging) |
not shown |
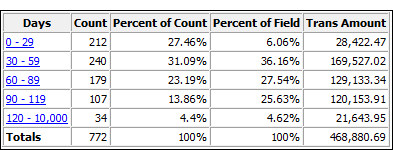
Aging results
Output results produced by:
- aging on invoice date in
an accounts receivable table
(the Ar table in ACL DATA\Sample Data Files\Sample Project.ACL)
- subtotaling transaction amount
- using 30-day aging periods
- outputting the results to screen
Note
If you output the results to screen or graph, the graph displays the count subtotals for each aging period, or the numeric subtotals if you include one or more numeric subtotal fields in the aging operation.
Steps
You can age data by grouping the records in a table into aging periods.
For each period, you can optionally include the following calculations for associated numeric fields: subtotal, average value, minimum value, maximum value.
- Select .
- On the Main tab, do one of the
following:
Select the field on which to base the aging from the Age On drop-down list.
Click Age On to select the field, or to create an expression.
- In the Cutoff Date field, leave
the default current date, or do one of the following to specify
a different cutoff date:
- Edit the date directly in the Cutoff Date field.
- Click the down arrow to select a date from the calendar. You can use the left or right arrows to move backward or forward one month at a time, or click the month and year, year, or decade at the top center of the calendar to move backward or forward in larger intervals of time.
Specifying a different cutoff date allows you to align the beginning of the first aging period with a date such as a fiscal period end date. If you leave the default date, the first aging period begins on the current date, which may or may not be appropriate for your analysis.
- Enter the aging periods to use in the Aging
Periods text box, or keep the default values.
The aging period values must be entered in days. Each value must be listed on a separate line from lowest to highest (most recent to oldest). A value of ‘0’ specifies that the first aging period begins on the specified cutoff date. The final value specifies the end of the oldest aging period.
Note
You can change the values used for the default aging periods by selecting and updating the Aging Periods on the Date and Time tab.
-
Optional. Select one or more Subtotal Fields, or click Subtotal Fields, to select the subtotal field(s), or to create an expression.
The order in which you select the subtotal fields is the order in which the columns appear in the results. If you are appending results to an existing Analytics table, the column selection and order must be identical to the column selection and order in the existing table.
-
If there are records in the current view that you want to exclude from processing, enter a condition in the If text box, or click If to create an IF statement using the Expression Builder.
Note
The If condition is evaluated against only the records remaining in a table after any scope options have been applied (First, Next, While).
The IF statement considers all records in the view and filters out those that do not meet the specified condition.
-
Optional. Select Include Statistics for Subtotal Fields if you want to calculate average, minimum, and maximum values for each subtotaled numeric field.
You must select at least one subtotal field in order to include statistics.
- Click the Output tab.
-
Select the appropriate output option in the To panel:
- Screen – Select this option to display the results in the Analytics display area.
Tip
You can click any linked result value in the display area to drill down to the associated record or records in the source table.
If the output table contains a large number of records, it is faster and more useful to save the results to a file than to display the results on the screen.
- Print – Select this option to send the results to the default printer.
- Graph – Select this option to create a graph of the results and display it in the Analytics display area.
- File – Select this option to save or append the results to a text file. The file is saved outside Analytics.
Note
Output options that do not apply to a particular analytical operation are disabled.
- Screen – Select this option to display the results in the Analytics display area.
-
If you selected File as the output type, specify the following information in the As panel:
- File Type – ASCII Text File or Unicode Text file (depending on which edition of Analytics you are using) is the only option. Saves the results to a new text file, or appends the results to an existing text file.
- Name – Enter a file name in the Name text box. Or click Name and enter the file name, or select an existing file in the Save or Save File As dialog box to overwrite or append to the file. If Analytics prefills a file name, you can accept the prefilled name, or change it.
You can also specify an absolute or relative file path, or navigate to a different folder, to save or append the file in a location other than the project location. For example: C:\Results\Output.txt or Results\Output.txt.
- Local – Disabled and selected. Saving the file locally is the only option.
-
Depending on the output type, you can optionally specify a Header and/or a Footer in the text box(es).
Headers and footers are centered by default. Type a left angle bracket (<) before the header or footer text to left align the text. Click Header or Footer to enter a header or footer of more than one line. Alternatively, you can enter a semi-colon (;) as a line-break character in the header or footer text box. Left aligning multiple lines requires a left angle bracket at the beginning of each line.
- Click the More tab.
-
Select the appropriate option in the Scope panel:
- All
- First
- Next
- While
 Show me more
All This option is selected by default. Leave it selected to specify that all records in the view are processed. First Select this option and enter a number in the text box to start processing at the first record in the view and include only the specified number of records. Next Select this option and enter a number in the text box to start processing at the currently selected record in the view and include only the specified number of records. The actual record number in the leftmost column must be selected, not data in the row. While Select this option to use a WHILE statement to limit the processing of records in the view based on a particular criterion or set of criteria. You can enter a condition in the While text box, or click While to create a WHILE statement using the Expression Builder.
A WHILE statement allows records in the view to be processed only while the specified condition evaluates to true. As soon as the condition evaluates to false, the processing terminates, and no further records are considered. You can use the While option in conjunction with the All, First, or Next options. Record processing stops as soon as one limit is reached.
Note
The number of records specified in the First or Next options references either the physical or the indexed order of records in a table, and disregards any filtering or quick sorting applied to the view. However, results of analytical operations respect any filtering.
If a view is quick sorted, Next behaves like First.
- If you want to exclude from the output results any values that fall outside the specified aging periods, select Suppress Others.
- If you want to break down the output results based on
the values in a character field, enter the field name in the Break text
box, or click Break to select the field,
or to create an expression.
For example, an aged summary of an accounts receivable table could be broken down by customer. Break can only be used with a single character field, so nested breakdowns are not supported.
Note
For the Break option to yield meaningful results, the character field must be sorted prior to aging.
- If you selected File as the output type, and want to append the output results to the end of an existing text file, select Append To Existing File.
- Click OK.
If you output the results to screen or graph, you can switch between the two output types using the Text and Graph buttons at the bottom of the display area.
- If the overwrite prompt appears, select the appropriate option.