Concept Information
Clustering groups the records in a table based on similar values in one or more numeric key fields. Similar values are values that are nearby or close to one another in the context of the entire data set. These similar values represent clusters that, once identified, reveal patterns in the data.
How clustering differs from other Analytics grouping commands
Clustering differs from other Analytics grouping commands:
- Clustering does not require grouping on exact values, or predefined strata with hard numeric boundaries. Instead, clustering groups data based on similar numeric values – that is, values that are close or nearby to one another.
- Clustering does not require pre-existing data categories.
- Clustering based on more than one field outputs results that are not nested (non-hierarchical).
Choosing the fields to cluster on
Clustering allows you to discover organic groupings in data that you may not know exist. You are free to create clusters based on multiple numeric fields. In this sense, clustering is exploratory, and an example of unsupervised machine learning.
However, in order to make sense of the output clusters, you need to understand the relation between the fields you select for clustering.
Cluster on a single field
Clustering on a single numeric field is relatively straightforward. You have a single set of values, and clustering groups the values based on closeness between values, or proximity. For example, you can cluster an amount field to find out where the amounts are concentrated over the range of values.
The benefit of clustering over a traditional approach like stratifying is that you do not have to make any assumptions, in advance, about where the concentrations may exist, or create arbitrary numeric boundaries. Clustering discovers where the boundaries lie for any given number of clusters.
Example of clustering on a single numeric field
You cluster the Ap_Trans table on the Invoice Amount field to find out where amounts are concentrated over the range of values. Your expectation is that most of the amounts will be clustered at the lower end of the range. You decide to group the Invoice Amount field into five clusters, and then summarize the clusters to discover how many records are in each cluster.
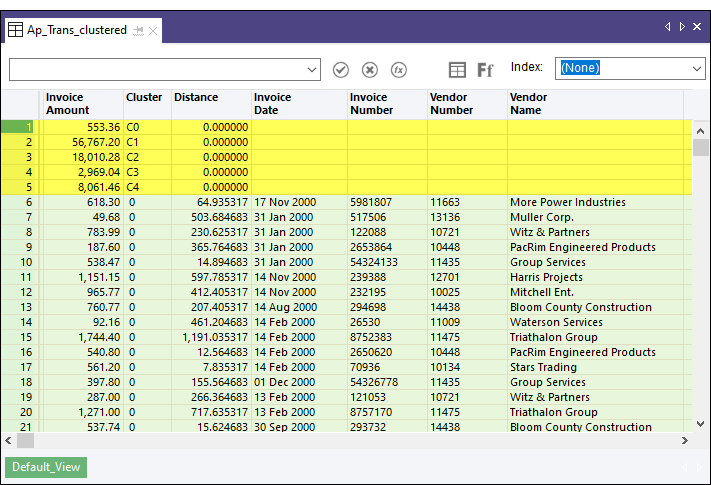
The output results
In the output results shown below, the first five records are system-generated and equate to the desired number of clusters that you specified. In the Invoice Amount field, the five records show the centroid, or center point, that the clustering algorithm calculates for each of the five clusters of invoice amounts. For example, the centroid for cluster 3 is 2,969.04. For more information, see How the clustering algorithm works.
Beneath the system-generated fields are the source data fields grouped into clusters, starting with cluster 0. The value in the Distance field is the distance from the actual invoice amount to the calculated centroid value for the cluster.
Summarizing the clusters
If you summarize the Cluster field, and sort the summarized output by count, you get the following results, which confirm that the distribution of values is what you expected. Overall, invoice amounts are heavily skewed to lower values. (Centroid values added to the table for ease of comparison.)
The single large value in a cluster by itself appears to be an outlier and should probably be investigated.
| Cluster | Count | Centroid value |
|---|---|---|
| 0 | 73 | 553.36 |
| 3 | 16 | 2,969.04 |
| 4 | 8 | 8,061.46 |
| 2 | 4 | 18,010.28 |
| 1 | 1 | 56,767.20 |
Cluster on multiple fields
When you cluster on two or more fields, you need to ask yourself how the fields might relate. You could use clustering to test a hypothesis. For example, a company might be concerned about the rate of employee turnover, which management thinks is concentrated among younger, lower-paid employees.
You could use clustering to discover if there is a strong relation between:
- length of employee retention and employee age (two-dimensional clustering)
- length of employee retention, employee age, and salary (three-dimensional clustering)
Note
For this analysis, you need to avoid including any fields that do not clearly relate to the hypothesis, such as number of sick days taken.
Assessing the output clusters
The clustering algorithm will always output a table with the specified number of clusters. Every record in the output table will be in a cluster.
At this point, you need to assess whether any of the clusters have analytical significance or meaning. Just because the algorithm groups records in a cluster does not necessarily mean the grouping is significant.
Two characteristics you can assess are cluster coherence and cluster size.
Tip
Graphing the cluster output table as a scatter plot in a reporting tool, with each cluster assigned a different color, is the easiest way to quickly assess the nature of the output clusters.
How the clustering algorithm works
Clustering in Analytics uses the K-means clustering algorithm, which is a popular machine learning algorithm. You can find detailed descriptions of K-means clustering on the Internet.
A summary of the algorithm appears below.
The K-means clustering algorithm uses an iterative process to optimize clusters:
| 1 | Specify the number of clusters |
|
|---|---|---|
| 2 | Initialize cluster centroids |
|
| 3 | Assign each data point to the nearest centroid |
|
| 4 | Recalculate the centroids |
|
| 5 | Iterate |
|
Choosing the number of clusters (K value)
Determining the optimal number of clusters to use when clustering data can require some testing and experimentation. For any given data set, there is not an exact answer.
Guidelines for determining the optimal number of clusters:
- Familiarize with the data Familiarize with the data set beforehand, to get a general idea of the profile of the data and any obvious concentrations of values.
- Go high initially Choose a relatively high number of clusters initially – 8 to 10.
- Try a different number of clusters Perform the clustering several times, specifying a different K value each time. A review of the output results can help you judge whether you need more or fewer clusters.
- Elbow method Use the elbow method, which compares the internal distances of values in the generated clusters for different K values.
You can plot the results of the elbow method to identify "the elbow", or the inflection point, where increasing the number of clusters does not significantly reduce the internal distances of the values in the clusters. The elbow method can be scripted in Analytics.
Can I cluster on character or datetime fields?
Generally, you cannot cluster on character or datetime fields. The clustering algorithm accepts only numbers, and it performs calculations with the numbers (Euclidean distance, mean).
Categorical character data
You might have categorical character data, such as location IDs, in the form of numbers. Or you could use a computed field to map character categories to a set of numeric codes that you create. You could convert this data to the numeric data type and use it for clustering. However, the resulting clusters would not be valid because you would be performing mathematical calculations on numbers that are representative of something non-numeric.
For example, calculating a centroid position based on the average of a list of location IDs results in a meaningless number. The calculation is based on the invalid assumption that the mathematical distance between location numbers equates to some real-world, measurable distance.
If we consider physical distance, to say that the distance between location 1 and location 9 is twice as far as the distance between location 1 and location 5 makes no sense. Locations 1 and 9 might be beside each other, and location 5 could be miles away.
For a cluster analysis involving location and physical distance, the valid data to use would be geographic coordinates.
Categorical data that represents a scale
You could cluster on categorical data that represents a scale – for example, a rating scale from Poor to Excellent, with corresponding numeric codes from 1 to 5. In this case, an average of the numeric codes has meaning.
Datetime data
You can use Analytics functions to convert datetime data to numeric data. However, the resulting numeric data is not continuous, which presents problems for cluster analysis, which assumes continuous sets of numbers.
For example, the following three numbers, as dates, are all one day apart. However, as numbers, there is a considerable gap, or distance, between the first and second numbers.
- 20181130
- 20181201
- 20181202
You could use serial date values in cluster analysis. Serial dates are a continuous set of integers representing the number of days that have elapsed since 01 January 1900.
Steps
Note
If the machine learning menu options are disabled, the Python engine is probably not installed. For more information, see Install ACL for Windows.
Specify settings for the clustering algorithm
- Open the table with the data that you want to cluster.
- From the Analytics main menu, select Machine Learning > Cluster.
- In Number of clusters (K Value), specify the number of clusters to use for grouping the data.
- In Maximum number of iterations, specify an upper limit for the number of iterations performed by the clustering algorithm.
- In Number of initializations, specify the number of times to generate an initial set of random centroids.
- Optional. Select Seed, and enter a number.
Specify a data preprocessing method
In the Preprocessing dropdown list, select the method for preprocessing the data before clustering it:
| Standardize | Center key field values around zero (0), and scale the values to unit variance when calculating the clusters |
|---|---|
| Scale to unit variance | Scale key field values to unit variance when calculating the clusters, but do not center the values around zero (0) |
| None | Use the raw key field values, unscaled, when calculating the clusters |
Select fields
- From the Cluster On list, select one or more key fields to use for clustering the records in the table.
Key fields must be numeric.
- Optional. From the Other Fields list, select one or more additional fields to include in the output table.
Tip
You can Ctrl+click to select multiple non-adjacent fields, and Shift+click to select multiple adjacent fields.
Finalize command inputs
-
If there are records in the current view that you want to exclude from processing, enter a condition in the If text box, or click If to create an IF statement using the Expression Builder.
Note
The If condition is evaluated against only the records remaining in a table after any scope options have been applied (First, Next, While).
The IF statement considers all records in the view and filters out those that do not meet the specified condition.
- In the To text box, specify the name of the output table.
- Optional. On the More tab:
- To specify that only a subset of records are processed, select one of the options in the Scope panel.
- Select Use Output Table if you want the output table to open automatically.
- Click OK.