Concept Information
Cross-tabulating groups the records in a table based on identical combinations of values in two or more key fields, and counts the number of records in each group. Key fields can be character or numeric.
The resulting groups are displayed in a grid of rows and columns, similar to a pivot table, that allows you to visualize relations and patterns in the data.
For example, you could cross-tabulate an inventory table on the Product Location and Product Class fields to find the number of records in each class at each location.
| Key field 1 (Product Location) |
Key field 2 (Product Class) |
Cross-tabulated group (Product Location and Product Class) |
Record count | |
|---|---|---|---|---|
| A-01 | 17 | A-01 | 16 | 1 |
| F-19 | 22 | A-01 | 17 | 3 |
| F-19 | 08 | B-03 | 17 | 2 |
| A-01 | 16 | F-19 | 22 | 2 |
| B-03 | 17 | F-19 | 08 | 1 |
| Q-28 | 03 | Q-28 | 03 | 1 |
| A-01 | 17 | |||
| F-19 | 22 | |||
| A-01 | 17 | |||
| B-03 | 17 | |||
Subtotaling numeric fields
When cross-tabulating, you can optionally subtotal one or more numeric fields. In the example above, you could subtotal the inventory value field to find the total inventory value for each product class at each location.
Cross-tabulating is similar to summarizing
Cross-tabulating is similar to summarizing using two fields. In both operations the counts and subtotals in the output results are the same, but the information is arranged differently.
Cross-tabulating also displays counts and subtotals of zero, which summarizing does not. Depending on the type of analysis you are doing, displaying counts and subtotals of zero can be useful.
Cross-tabulating and sorting
You can cross-tabulate sorted or unsorted tables. When you cross-tabulate an unsorted table Analytics automatically sorts the output results as part of the cross-tabulate operation.
Cross-tabulating in detail
Cross-tabulating performs the following operations:
| Operation | Location in Cross-tabulate results |
|---|---|
| Groups the records based on identical combinations of values in two or more character or numeric fields, and displays the groups in a grid of rows and columns | intersections of Cust Number field (rows) and Type field (columns) |
| Optionally subtotals the values of one or more numeric fields for each group | Amount field |
| Optionally counts (subtotals) the number of records for each group Note Counts are automatically included if you do not select any subtotal fields. |
Count field |
|
Provides totals for all columns included in the output results |
Totals row |
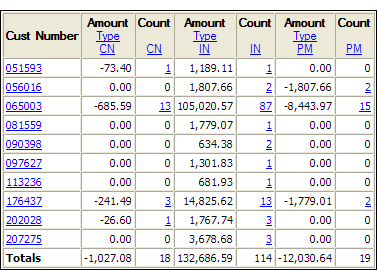
Cross-tabulate results
Output results produced by:
- cross-tabulating customer number and transaction type in an accounts receivable table
(the Ar table in ACL DATA\Sample Data Files\Sample Project.ACL)
- subtotaling transaction amount
- outputting the results to screen
Steps
You can cross-tabulate data by grouping the records in a table based on identical combinations of values in two or more character or numeric fields.
The resulting groups are displayed in a grid of rows and columns, similar to a pivot table, that allows you to visualize relations and patterns in the data.
- Select .
- On the Main tab, do one of the
following:
Select the field(s) to display as rows from the Rows list.
Click Rows to select the field(s), or to create an expression.
If you select more than one field you create an additional level of nesting in the output results. (Cross-tabulating using one row and one column is already a form of nesting.) The order in which you select the fields dictates the nesting hierarchy. The records are cross-tabulated by the first field you select, and within each of these primary groupings the records are then cross-tabulated by the second field you select, and so on. Reversing the order in which you select two fields gives quite different results.
The order in which you select the fields is also the order in which they appear in the results. If you are appending results to an existing Analytics table, the column selection and order must be identical to the column selection and order in the existing table.
- Do one of the following:
Select the field to display as columns from the Columns drop-down list.
Click Columns to select the field, or to create an expression.
-
Optional. Select one or more Subtotal Fields, or click Subtotal Fields, to select the subtotal field(s), or to create an expression.
The order in which you select the subtotal fields is the order in which the columns appear in the results. If you are appending results to an existing Analytics table, the column selection and order must be identical to the column selection and order in the existing table.
-
If there are records in the current view that you want to exclude from processing, enter a condition in the If text box, or click If to create an IF statement using the Expression Builder.
Note
The If condition is evaluated against only the records remaining in a table after any scope options have been applied (First, Next, While).
The IF statement considers all records in the view and filters out those that do not meet the specified condition.
- If you want to include a count of the number of records
for each row-column intersection, select Include Count.
A count is automatically included if you do not select any subtotal fields.
- Click the Output tab.
-
Select the appropriate output option in the To panel:
- Screen – Select this option to display the results in the Analytics display area.
Tip
You can click any linked result value in the display area to drill down to the associated record or records in the source table.
If the output table contains a large number of records, it is faster and more useful to save the results to a file than to display the results on the screen.
- Print – Select this option to send the results to the default printer.
- Graph – Select this option to create a graph of the results and display it in the Analytics display area.
- File – Select this option to save or append the results to an Analytics table or a text file. If you save or append to an Analytics table, the table is added to the open project if it is not already in the project. If you save or append to a text file, the file is saved outside Analytics.
Note
Output options that do not apply to a particular analytical operation are disabled.
- Screen – Select this option to display the results in the Analytics display area.
-
If you selected File as the output type, specify the following information in the As panel:
- File Type – Select Analytics Table to save the results to a new Analytics table, or append the results to an existing Analytics table. Select ASCII Text File or Unicode Text file (depending on which edition of Analytics you are using) to save or append the results to a text file.
- Name – Enter a file name in the Name text box. Or click Name and enter the file name, or select an existing file in the Save or Save File As dialog box to overwrite or append to the file. If Analytics prefills a file name, you can accept the prefilled name, or change it.
You can also specify an absolute or relative file path, or navigate to a different folder, to save or append the file in a location other than the project location. For example: C:\Results\Output.fil or Results\Output.fil.
- Local – Only enabled when connected to a server table and saving or appending the results to an Analytics table. Select Local to save the file to the same location as the project, or to specify a path or navigate to a different local folder. Leave Local deselected to save the file to the Prefix folder on a server.
Note
For output results produced from analysis or processing of AX Server tables, select Local. You cannot deselect the Local setting to import results tables to AX Server.
-
Depending on the output type, you can optionally specify a Header and/or a Footer in the text box(es).
Headers and footers are centered by default. Type a left angle bracket (<) before the header or footer text to left align the text. Click Header or Footer to enter a header or footer of more than one line. Alternatively, you can enter a semi-colon (;) as a line-break character in the header or footer text box. Left aligning multiple lines requires a left angle bracket at the beginning of each line.
- Click the More tab.
-
Select the appropriate option in the Scope panel:
- All
- First
- Next
- While
 Show me more
All This option is selected by default. Leave it selected to specify that all records in the view are processed. First Select this option and enter a number in the text box to start processing at the first record in the view and include only the specified number of records. Next Select this option and enter a number in the text box to start processing at the currently selected record in the view and include only the specified number of records. The actual record number in the leftmost column must be selected, not data in the row. While Select this option to use a WHILE statement to limit the processing of records in the view based on a particular criterion or set of criteria. You can enter a condition in the While text box, or click While to create a WHILE statement using the Expression Builder.
A WHILE statement allows records in the view to be processed only while the specified condition evaluates to true. As soon as the condition evaluates to false, the processing terminates, and no further records are considered. You can use the While option in conjunction with the All, First, or Next options. Record processing stops as soon as one limit is reached.
Note
The number of records specified in the First or Next options references either the physical or the indexed order of records in a table, and disregards any filtering or quick sorting applied to the view. However, results of analytical operations respect any filtering.
If a view is quick sorted, Next behaves like First.
-
If you selected File (Analytics Table) as the output type, select Use Output Table if you want the output table to open automatically upon completion of the operation.
- If you selected File as the output
type, and want to append the output results to the end of an existing
file, do one of the following:
Select Append To Existing File if you are appending to a text file, or to an Analytics table that you are certain is identical in structure to the output results.
Leave Append To Existing File deselected if you are appending to an Analytics table and you want Analytics to compare the record lengths of the output results and the existing table. If the record lengths are not identical, the data structure is not identical, and the append will not work correctly.
Note
Leaving Append To Existing File deselected is recommended if you are uncertain whether the output results and the existing table have an identical data structure. For more information about appending and data structure, see Appending output results to an existing table.
- Click OK.
- If the overwrite prompt appears, select the appropriate
option.
If you are expecting the Append option to appear and it does not, click No to cancel the operation and see Appending output results to an existing table.