Use automated machine learning in Analytics to predict classes or numeric values associated with unlabeled data. Data is unlabeled if the classes or numeric values you are interested in do not exist in the data. For example, you could use machine learning to predict loan defaults, or future house prices:
| Prediction problem | Prediction type | Description |
|---|---|---|
| Loan defaults | Classification |
Based on applicant information such as age, job category, credit score, and so on, predict which applicants will default if given a loan. Put another way, will applicants fall into the class of Default = Yes, or Default = No? |
| Future house prices | Regression | Based on features such as age, square footage, ZIP code, number of bedrooms and bathrooms, and so on, predict the future sale price of houses. |
Automated machine learning
Machine learning in Analytics is "automated" because two related commands – Train and Predict – perform all the computational work associated with training and evaluating a predictive model, and applying the predictive model to an unlabeled data set. The automation provided by Analytics allows you to put machine learning to work on company data without requiring that you have specialized data science capabilities.
The train and predict workflow
The train and predict workflow is composed of two related processes, and two related data sets:
- Training process uses a training data set (labeled)
- Prediction process uses a new data set (unlabeled)
Training process
The training process is performed first, using a training data set that includes a labeled field (also called a target field).
The labeled field contains the known class, or the known numeric value, associated with each record in the training data set. For example, whether a borrower defaulted on a loan (Y/N), or the sale price of a house.
Using machine learning algorithms, the training process generates a predictive model. The training process generates a number of different model permutations in order to discover the model that is best suited to the predictive task you are performing.
Prediction process
The prediction process is performed second. It applies the predictive model generated by the training process to a new, unlabeled data set that contains data similar to the data in the training data set.
Label values such as loan default information or house sale price do not exist in the new data set because these are future events.
Using the predictive model, the prediction process predicts a class or a numeric value associated with each unlabeled record in the new data set.
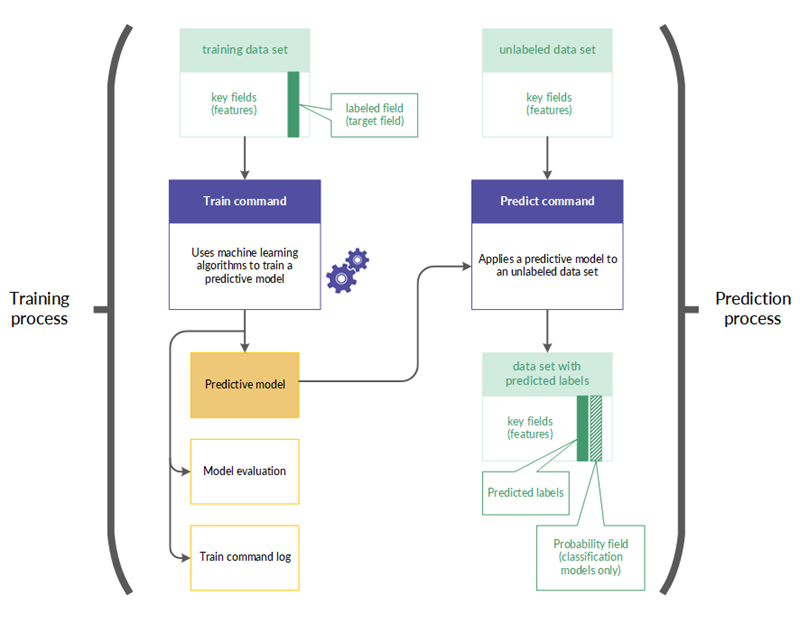
The train and predict workflow in more detail
| Process | Description | Data set examples | |
|---|---|---|---|
| 1 |
Training (Train command) |
|
|
| 2 |
Prediction (Predict command) |
|
|
Processing time
The computation required by machine learning is time consuming and processor-intensive. Training a predictive model using a large data set with numerous fields can take hours, and is typically a task you might run overnight.
Including datetime key fields in the training process is particularly processor-intensive because each datetime field is used to automatically derive 10 synthetic features. Datetime synthetic features can significantly expand the scope of the predictive data, but you should only include datetime fields if you think that they might be relevant.
Tip
If you are just familiarizing yourself with machine learning in Analytics, use small data sets so that you can keep processing times manageable, and see results relatively quickly.
Strategies for reducing the size of the training data set
You can use different strategies to reduce the size of the training data set, and the associated processing time, without significantly affecting the accuracy of the resulting predictive model.
- Exclude fields from the training process that do not contribute to predictive accuracy. Exclude irrelevant fields, and redundant fields.
- Exclude datetime fields from the training process if they do not contribute to predictive accuracy. Although, be careful about assuming that datetime fields are not relevant. For more information, see Datetime key fields.
- Sample the training data set and use the sampled data as input for the training process. Possible sampling approaches include:
- balancing the size of data classes by sampling majority classes to approximate average minority class size
- random sampling of the entire training data set
- stratified sampling based on features
- stratified sampling based on clustering
Datetime key fields
You can use one or more datetime fields as key fields when training a predictive model. Typically, too many unique values exist in a datetime field for the field to be a suitable source of categories or identifiable features for the training process. Raw datetime data may also appear unrelated to your target field of interest.
However, once categorized, datetime data may have relevance. For example, events that you are examining may have a pattern of occurring on certain days of the week, or during certain times of the day.
The training process automatically derives a number of synthetic features from each datetime field by categorizing the raw datetime data. These synthetic features are then included in the algorithm that generates a predictive model.
Synthetic features derived from datetime fields
The synthetic features automatically derived from date, time, or datetime fields are listed below.
| Description of synthetic feature | Feature type | Synthetic feature name |
|---|---|---|
| Day of the week | Numeric (1 to 7) | fieldname_DOW |
| Month of the year | Numeric (1 to 12) | fieldname_MONTH |
| Quarter | Numeric (1 to 4) | fieldname_QTR |
| Number of days since the start of the month | Numeric (1 to 31) | fieldname_DAY |
| Number of days since the start of the year | Numeric (1 to 366) | fieldname_DOY |
| Seconds | Numeric (00 to 59) | fieldname_SECOND |
| Hour of the day | Numeric (1 to 24) | fieldname_HOUR |
| Number of seconds since the start of the day | Numeric (1 to 86400) | fieldname_SOD |
| Quartile of the day |
Categorical:
|
fieldname_QOD |
| Octile of the day |
Categorical:
|
fieldname_OOD |
Training a predictive model
Note
The maximum supported size of the data set used with the training process is 1 GB.
If the machine learning menu options are disabled, the Python engine is probably not installed. For more information, see Install ACL for Windows.
Steps
Specify basic settings for the training process
- Open the Analytics table with the training data set.
- From the Analytics main menu, select Machine Learning > Train.
- Specify the time allotted to the training process:
Time to search for an optimal model The total time in minutes to spend generating and testing predictive models, and selecting a winning model.
Specify a search time that is at least 10x the maximum evaluation time per model.
Maximum time per model evaluation Maximum runtime in minutes per model evaluation.
Allot 45 minutes for every 100 MB of training data.
Note
The total runtime of the training process is the search time plus up to twice the maximum model evaluation time.
The suggested time allotments strike a reasonable balance between processing time and allowing a variety of model types to be evaluated.
- Specify the prediction type to use:
- Classification use classification algorithms to train a model
Use classification if you want to predict which class or category records in an unlabeled data set belong to.
- Regression use regression algorithms to train a model
Use regression if you want to predict numeric values associated with records in an unlabeled data set.
For information about the specific algorithms used with classification and regression, see Training algorithms.
- Classification use classification algorithms to train a model
- In the Model scorer drop-down list, select the metric to use when scoring the models generated during the training process.
The generated model with the best value for this metric is kept, and the rest of the models are discarded.
A different subset of metrics is available depending on the prediction type you are using:
Classification Log loss | AUC | Accuracy | F1 | Precision | Recall Regression Mean squared error | Mean absolute error | R2 Note
The classification metric AUC is only valid when used with a target field that contains binary data – that is, two classes, such as Yes/No, or True/False.
Select fields
- From the Train On list, select one or more key fields to use as input when training the model.
Key fields are the features that form the basis for predicting target field values in an unlabeled data set. Key fields can be character, numeric, datetime, or logical. Synthetic features are automatically derived from datetime key fields.
Note
Character fields must be "categorical". That is, they must identify categories or classes, and they cannot exceed a maximum number of unique values.
The maximum is specified by the Maximum Categories option (Tools > Options > Command).
Tip
You can Ctrl+click to select multiple non-adjacent fields, and Shift+click to select multiple adjacent fields.
- From the Target Field list, select the target field.
The target field is the field that the model is being trained to predict based on the input key fields.
Classification and regression work with different target field data types:
- classification a character or logical target field
- regression a numeric target field
Name the model file and the output ACL table
- In the Model Name text box, specify
the name of the model file output by the training process.
The model file contains the model best fitted to the training data set. You will input the model file to the prediction process to generate predictions about a new, unseen data set.
- In the To text box, specify
the name of the model evaluation table output by the training process.
The model evaluation table contains two distinct types of information:
- Scorer/Metric for the classification or regression metrics, quantitative estimates of the predictive performance of the model file output by the training process
- Importance/Coefficient in descending order, values indicating how much each feature (predictor) contributes to the predictions made by the model
-
If there are records in the current view that you want to exclude from processing, enter a condition in the If text box, or click If to create an IF statement using the Expression Builder.
Note
The If condition is evaluated against only the records remaining in a table after any scope options have been applied (First, Next, While).
The IF statement considers all records in the view and filters out those that do not meet the specified condition.
Specify that only a subset of the training data set is used (optional)
On the More tab, select one of the options in the Scope panel:
| All (default) | All records in the table are processed. |
| First | Select this option and enter a number in the text box to start processing at the first record in the table and include only the specified number of records. |
| Next |
Select this option and enter a number in the text box to start processing at the currently selected record in the table view and include only the specified number of records. The actual record number in the leftmost column must be selected, not data in the row. |
| While |
Select this option to use a WHILE statement to limit the processing of records in the table based on criteria. |
Specify advanced settings for the training process
- On the More tab, specify the Number of cross-validation folds.
Leave the default number of 5, or specify a different number. Valid numbers are from 2 to 10.
Folds are subdivisions of the training data set, and are used in a cross-validation process during model evaluation and optimization.
Typically, using from 5 to 10 folds yields good results when training a model.
Tip
Increasing the number of folds can produce a better estimate of the predictive performance of a model, but it also increases overall runtime.
- Optional. Select Seed, and enter a number.
The seed value is used to initialize the random number generator in Analytics.
If you do not select Seed, Analytics randomly selects the seed value.
Explicitly specify a seed value, and record it, if you want to replicate the training process with the same data set in the future.
- Optional. If you want to train and score only linear models, select Only evaluate linear models.
If you leave this option unselected, all model types relevant to classification or regression are evaluated.
Note
With larger data sets, the training process typically completes more quickly if you include only linear models.
Including only linear models guarantees coefficients in the output.
- Optional. Select Disable feature selection and preprocessing if you want to exclude these subprocesses from the training process.
Feature selection is the automated selection of the fields in the training data set that are the most useful in optimizing the predictive model. Automated selection can improve predictive performance, and reduce the amount of data involved in model optimization.
Data preprocessing performs transformations such as scaling and standardizing on the training data set to make it better suited for the training algorithms.
Caution
You should only disable feature selection and data preprocessing if you have a reason for doing so.
- Click OK.
The training process launches, and a dialog box appears that shows the input settings you specified, and elapsed processing time.
Applying a predictive model to an unlabeled data set
Note
If the machine learning menu options are disabled, the Python engine is probably not installed. For more information, see Install ACL for Windows.
Steps
- Open the Analytics table with the unlabeled data set.
- From the Analytics main menu, select Machine Learning > Predict.
- Click Model, in the Select File dialog box select a model file output by a previous training process, and click Open.
Model files have a *.model file extension.
Note
The model file must have been trained on a data set with the same fields as the unlabeled data set – or substantially the same fields.
You cannot use a model file trained in version 14.1 of Analytics. Version 14.1 model files are not compatible with subsequent versions of Analytics. Train a new predictive model to use with the prediction process.
- In the To text box, specify
the name of the Analytics table output by the prediction process.
The output table contains the key fields you specified during the training process, and either one or two fields generated by the prediction process:
- Predicted the predicted classes or numeric values associated with each record in the unlabeled data set
- Probability (classification only) the probability that a predicted class is accurate
-
If there are records in the current view that you want to exclude from processing, enter a condition in the If text box, or click If to create an IF statement using the Expression Builder.
Note
The If condition is evaluated against only the records remaining in a table after any scope options have been applied (First, Next, While).
The IF statement considers all records in the view and filters out those that do not meet the specified condition.
- Optional. To process only a subset of the unlabeled data set, on the More tab select one of the options in the Scope panel.
- Click OK.
Training algorithms
Three train command options dictate which machine learning algorithms are used for training a predictive model:
| Option | Train dialog box tab |
|---|---|
| Classification or Regression | Main tab |
| Only evaluate linear models | More tab |
| Disable feature selection and preprocessing | More tab |
The sections that follow summarize how the options control which algorithms are used.
The names of the algorithms do not appear in the Analytics user interface. The name of the algorithm used for generating the model ultimately selected by the train command appears in the log.
Classification algorithms
![]() Algorithm used
Algorithm used ![]() Algorithm not used
Algorithm not used
| Algorithm name | Always included | Only evaluate linear models | Disable feature selection and preprocessing | ||
|---|---|---|---|---|---|
| Option not selected (default) | Option selected | Option not selected (default) | Option selected | ||
| Algorithm type: Classifier | |||||
| Logistic Regression |
|
||||
| Linear Support Vector Machine |
|
||||
| Random Forest |
|
|
|||
| Extremely Randomized Trees |
|
|
|||
| Gradient Boosting Machine |
|
|
|||
| Algorithm type: Feature preprocessor | |||||
| One Hot Encoding – of categorical features |
|
||||
| Fast Independant Component Analysis |
|
|
|||
| Feature Agglomeration |
|
|
|||
| Principal Component Analysis – Singular Value Decomposition |
|
|
|||
| Second Degree Polynomial Features |
|
|
|||
| Binarizer |
|
|
|||
| Robust Scaler |
|
|
|||
| Standard Scaler |
|
|
|||
| Maximum Absolute Scaler |
|
|
|||
| Min Max Scaler |
|
|
|||
| Normalizer |
|
|
|||
| Nystroem Kernel Approximation |
|
|
|||
| RBF Kernel Approximation |
|
|
|||
| Zero Counter |
|
|
|||
| Algorithm type: Feature selector | |||||
| Family-wise Error Rate |
|
|
|||
| Percentile of Highest Scores |
|
|
|||
| Variance Threshold |
|
|
|||
| Recursive Feature Elimination |
|
|
|||
| Importance Weights |
|
|
|||
Regression algorithms
![]() Algorithm used
Algorithm used ![]() Algorithm not used
Algorithm not used
| Algorithm name | Always included | Only evaluate linear models | Disable feature selection and preprocessing | ||
|---|---|---|---|---|---|
| Option not selected (default) | Option selected | Option not selected (default) | Option selected | ||
| Algorithm type: Regressor | |||||
| Elastic Net |
|
||||
| Lasso |
|
||||
| Ridge |
|
||||
| Linear Support Vector Machine |
|
||||
| Random Forest |
|
|
|||
| Extremely Randomized Trees |
|
|
|||
| Gradient Boosting Machine |
|
|
|||
| Algorithm type: Feature preprocessor | |||||
| One Hot Encoding – of categorical features |
|
||||
| Fast Independant Component Analysis |
|
|
|||
| Feature Agglomeration |
|
|
|||
| Principal Component Analysis – Singular Value Decomposition |
|
|
|||
| Second Degree Polynomial Features |
|
|
|||
| Binarizer |
|
|
|||
| Robust Scaler |
|
|
|||
| Standard Scaler |
|
|
|||
| Maximum Absolute Scaler |
|
|
|||
| Min Max Scaler |
|
|
|||
| Normalizer |
|
|
|||
| Nystroem Kernel Approximation |
|
|
|||
| RBF Kernel Approximation |
|
|
|||
| Zero Counter |
|
|
|||
| Algorithm type: Feature selector | |||||
| Family-wise Error Rate |
|
|
|||
| Percentile of Highest Scores |
|
|
|||
| Variance Threshold |
|
|
|||
| Importance Weights |
|
|
|||