Defining and importing print image (report) files and PDF files
Print image files, also called report files, are electronic copies of printed reports. Adobe PDF files are application files or scanned files that have been saved in the standard PDF format. The way you define and import print image files or PDF files is almost identical. For that reason, most of the topics in this section apply to both file types.
PDFs can be more challenging to define and import than print image files because data columns that appear to be aligned in the source PDF may become misaligned once Analytics has parsed the PDF (part of the file definition process). Analytics includes two PDF parsers: Xpdf and VeryPDF. You can try using both parsers to see if one gives better results.
Caution
Use control totals to verify that the Analytics table created from an imported print image or PDF file contains all the data from the source file. Unintentionally excluding records is a possibility when defining print image or PDF files. You should always verify that you have a complete data set in Analytics before beginning any analysis.
Key points for successfully defining a print image or PDF file
Defining a print image or PDF file can be tricky. It is more of an art than a science, one that can require you to carefully analyze the arrangement of the data in the source file in order to plan an effective approach. Arrangements of data in print image or PDF files are typically less standardized than arrangements in other file formats, which complicates the definition process. Success can require an iterative process.
There are a number of key points or techniques, outlined below, that can help you avoid frustration. It is recommended that you review these points carefully before, or as, you define a file, or if you encounter problems.
General points
Misaligned data
Fields and records
- Fields are blue, records are gray, and undefined data is white
- You can define three kinds of data: detail, header, and footer
- Do not select field names in the source file
Capturing records
- Specify a unique value to capture a set of records
- Tips for choosing a unique value
- Precisely capture a set of records
- Use multiple criteria to capture a set of records
- Check record definitions and field definitions throughout the entire file
- You can define multiline records and fields
Additional considerations
- Define and import only data you need
- Control the order of fields in the resulting Analytics table
- Analytics may auto-define a file
- Use control totals to verify the resulting Analytics table
General points
The file definition process is iterative
Successfully defining a print image or PDF file is typically an iterative process and may require a certain amount of trial and error. You will need to perform some or all of the following individual tasks:
- define one or more fields
- define a set of detail records based on a unique value
- define one or more header or footer records
- modify or further build criteria to fine tune a captured set of records
- review each field and record definition for accuracy
- edit inaccurate field or record definitions
- make multiple passes through a file as one way of dealing with misaligned data
You will get better with practice
Defining print image or PDF files may initially seem quite difficult – especially defining files with misaligned data. With practice, you will get better at assessing the structure of the data in a source file, and finding appropriate methods for defining it.
You can use two of the sample files included with Analytics to practice:
- REPORT3.TXT is easier to define. Analytics auto-defines the detail records in the file, however you need to edit the auto-definition because it contains errors.
- Inventory.pdf is more challenging to define because it contains misaligned data (unless you parse the file page by page). Analytics is unable to auto-define any part of the misaligned file, so you must create a manual definition from scratch.
Analytics auto-defines the detail fields and records in another sample file, Report.txt, perfectly. You may find it useful to study the auto-definition of Report.txt in the Data Definition Wizard.
Misaligned data
Workarounds for misaligned data
In the Data Definition Wizard, misaligned data columns in a parsed PDF or print image file (see Aligned and misaligned data in a parsed PDF file) can make it difficult or labor-intensive to create an Analytics table that is usable. If misaligned data is a significant problem, consider any of the following approaches.
Note
The most suitable approach for your situation depends on the nature of the data you are trying to define, and your experience with Analytics. New users of Analytics should consider asking for the data in a different format.
- Go back to the source of the file and ask for the data in a different format.
- Try converting the file using conversion software — for example, software that converts a PDF file to an Excel file or a text file. Import the converted file to Analytics.
- Try copying and pasting PDF data into a text editor. Then import the text file to Analytics.
- Use one or more of the following techniques to define misaligned
fields:
- Create a field definition that is long enough to capture the leftmost and the rightmost characters in a misaligned field.
- Create overlapping field definitions.
- Create a single, long field definition that encompasses multiple misaligned fields.
For more information, see Defining misaligned fields in a print image or PDF file.
- Import the source file more than once. With each import,
define a different subset of records. Append the resulting Analytics tables
to assemble a complete data set.
For more information, see Defining and importing subsets of print image or PDF data.
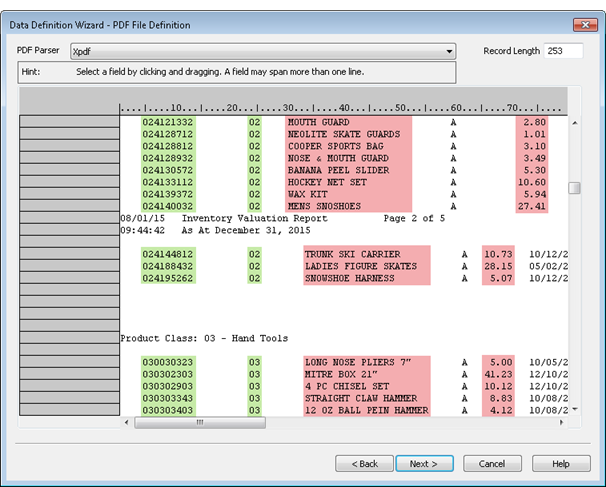
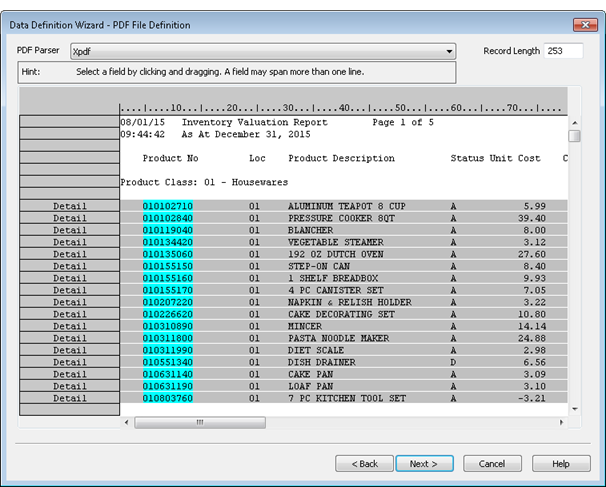
Aligned and misaligned data in a parsed PDF file
The two leftmost data columns in the parsed PDF file shown below are aligned. The remainder of the data columns are misaligned.
Fields and records
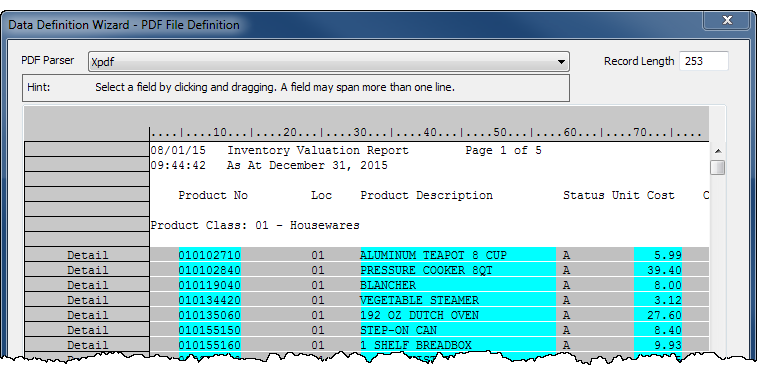
Fields are blue, records are gray, and undefined data is white
As you use the Data Definition Wizard to define fields and records in a print image or parsed PDF file, three colors indicate the status of the data:
- Aqua-blue highlighting indicates that the data is part of a defined field. All defined fields are also part of a defined record.
- Gray highlighting indicates that the data is part of a defined record, but is not part of a defined field.
- White background indicates that the data is completely undefined.
Note
Only aqua-blue highlighted fields become part of the resulting Analytics table.
Gray highlighted data in a defined record is ignored unless it is also defined as a field. The gray portions of a record between defined fields are omitted in the resulting Analytics table.
Completely undefined data is ignored. If you want to include any of this data in the resulting Analytics table, you must define additional fields and records.
Defined fields, defined record, and undefined data
You can define three kinds of data: detail, header, and footer
In the Data Definition Wizard, you can define three kinds of data in a print image or PDF file.
| Kind of data | Description | Example |
Location in |
|---|---|---|---|
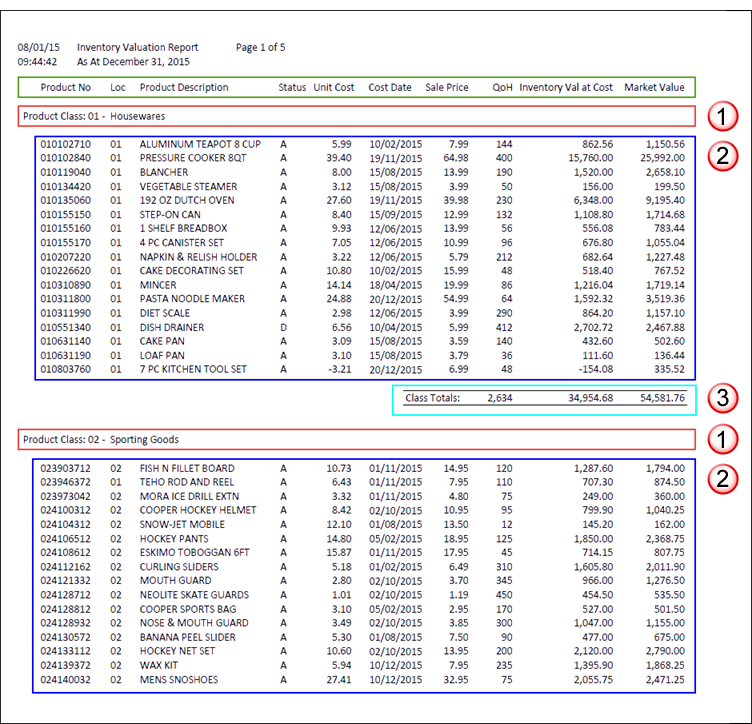
| Detail data |
The basic content of a file, arranged in records. Defining detail data is mandatory. You cannot define a print image or PDF file without defining detail data. |
|
#2, outlined in blue |
| Header data |
The identifying information that appears above blocks or subsets of detail records. Defining header data is optional. If you do not need the header information, you do not need to define it. |
|
#1, outlined in red |
| Footer data |
The information that appears below blocks or subsets of detail records. Defining footer data is optional. If you do not need the footer information, you do not need to define it. |
|
#3, outlined in aqua-blue |
Additional guidelines
- You can define detail, header, or footer data in any order you want. A sequence is not enforced.
- You
can also specify field names (outlined in green in The different kinds of data in a PDF
file). The method for specifying field names differs from the process
for defining detail, header, or footer data.
Note
Do not use Header data to attempt to define field names that may appear in a print image or PDF file.
The different kinds of data in a PDF file
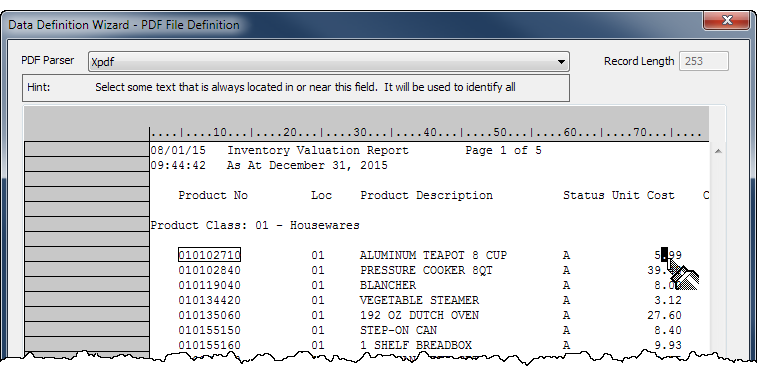
The example below highlights the different kinds of data in a PDF of an inventory valuation report.
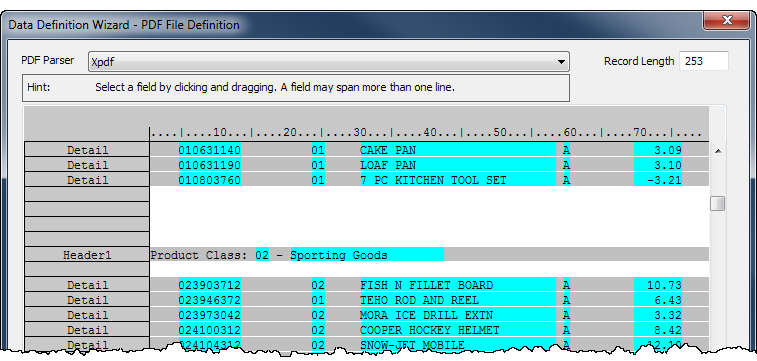
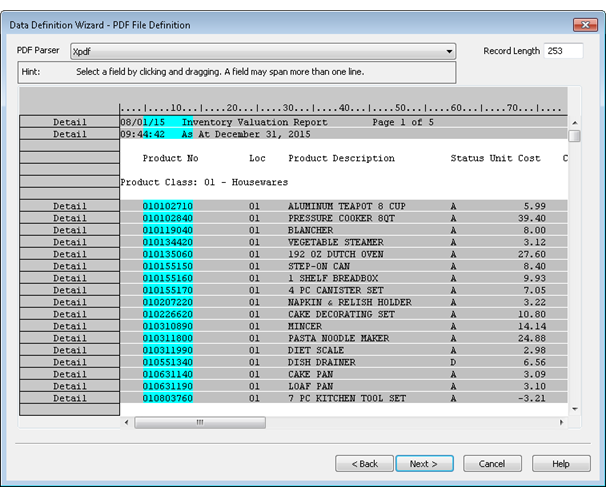
Detail data and header data in a parsed PDF file
The example below shows the inventory valuation report above once it has been parsed in the Data Definition Wizard. One detail record with five fields, and one header record with two fields, have been defined.
How header and footer data is treated
Although the Data Definition Wizard treats header or footer data like a record with fields, only detail data becomes an actual set of records in the resulting Analytics table. Any header or footer data you define becomes one or more fields added to the detail records.
The added header and footer fields repeat the same value for every record in an individual block or subset of records. For example, “Store 3” for one block of records, “Store 4” for the next block, and so on.
Do not select field names in the source file
Do not attempt to define field names by selecting them in the print image or PDF file. Although it may feel counter-intuitive, leave all field names in the source file unselected. Instead, you create field names by typing their names into the Field Definition dialog box. If you select field names in the source file, Analytics treats the field names as data contained in fields.
Specify a unique value to capture a set of records
The key to accurately capturing a set of records is selecting or specifying a value unique to the set of records. In other words, the value appears in a specific byte position (character position) in all the records in the set, and does not appear in that position anywhere else in the source file. The unique value can be one character or multiple characters.
For example, in Selecting a value unique to the set of records, the decimal point in the “Unit Cost” field is selected as the unique value. It appears in the same position in every amount in the field, and it does not appear in that position above or below the field.
You can select or specify the unique value in either of two places:
- In the initial data value you select to begin defining the initial data field
- In the same row as the initial data value
Selecting a value unique to the set of records
In the example below, the unique value is in the same row as the initial data value. The initial data value, surrounded by a box after being selected, is the first product number in the “Product No” field.
Tips for choosing a unique value
To choose a unique value, look for record data in which one or more consistently positioned characters are unique, or uniquely positioned, when compared to data above or below the set of records.
Any of the following possibilities could be good candidates for the unique value because they normally appear in the same position in every record, and they do not normally appear in that position outside the set of records:
- a decimal point in numbers
- one or both slashes in dates
- one or more hyphens in ID numbers
- a string of characters forming a standard prefix
- in header or footer data, a label that appears consistently, such as “Customer ID:” or “Subtotal:”
The initial selection of the unique value creates an Exact Match criterion in the Record Definition dialog box. In the example below, the criterion specifies that a decimal point must appear in byte position 74 in order for any record to be included in the set of records.
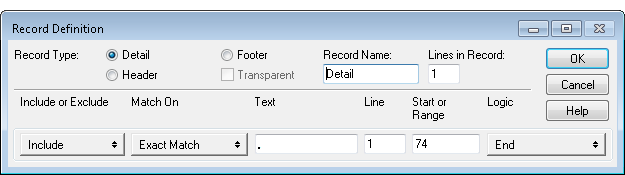
If required, you can change the exact match to a generic match, such as Numeric, or Non-Blank, which can provide greater flexibility when specifying a unique value. For more information, see Working with record definitions.
Precisely capture a set of records
Precisely capturing a set of records can be challenging. You may choose a value you think is unique to the set of records you want to capture and discover that some of the required records are not captured, or additional non-record data is captured.
To understand this situation better, it may help to think of a print image or PDF file as a grid formed by columns and rows. Imagine each column is exactly one character or one space wide, and extends from the very top of the file to the very bottom of the file.
When you select or specify a value, in a specific position, to capture a set of records, Analytics considers any character or characters in that position, from the top of the file to the bottom, as it searches for the value. Characters are considered even if they are outside those rows that you consider record data. If the value you specified is not sufficiently precise, additional, non-record data can be captured and included in the set of records.
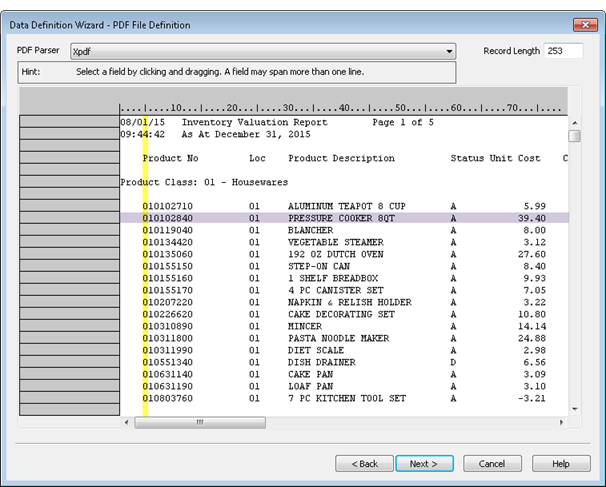
Imprecisely defined data field
In the example above, if you specified a generic numeric value in the first position of the “Product No” field as the unique value for capturing a set of records, any numbers in that position anywhere in the file would be captured in addition to the actual first digit of the product number. See the example below.
Precisely defined data field
If, however, you specified a generic numeric value encompassing all nine digits of the field, you would create a criterion that is sufficiently precise to capture only the intended set of records.
Use multiple criteria to capture a set of records
You may find that a single criterion, such as a slash in a date field, is not sufficient to precisely capture a set of records. Perhaps some of the date values are missing. Or, by chance, a slash appears in the same position in header or footer information, outside the set of records you want to capture. In this situation, you can add additional criteria to fine-tune the captured set of records.
Note
You can use criteria to either include or exclude rows in the source file.
Some examples of multiple criteria:
- Include rows that have the first slash in a date field AND the second slash in the date field
- Include rows that have the decimal point in a numeric field AND exclude rows that contain the word “Subtotal”
- Include rows that have alpha characters in the first specified set of byte positions OR include rows that have alpha characters in the second specified set of byte positions
For more information, see Working with record definitions.
Check record definitions and field definitions throughout the entire file
As you define records and fields, make sure to scroll through the file to check the accuracy of the definitions. Blank values, unexpected characters, and misaligned data can cause any of the following problems:
- some of the records in the file are excluded
- non-record data is incorrectly captured as a record
- field data is incompletely contained within a field definition, which truncates values
- data from two different fields appears in a single field definition
If a record definition is incorrect, you need to modify or further build the criteria used to capture the set of records. For more information, see Working with record definitions.
If a field definition is incorrect, you need to edit the definition. For more information, see Working with field definitions.
You can define multiline records and fields
You can define record or field data that extends beyond one line or one row in a source file. For example, the address data in each record could be arranged on multiple lines. For more information, see Working with multiline records and fields.
Define and import only data you need
Do not waste time or complicate the definition and import process by defining data fields you do not need for your analysis. Only define header or footer records if they add valuable information. Each additional data element you include can add complexity and make the definition process more difficult.
Control the order of fields in the resulting Analytics table
The order in which you define fields in a detail record is the order in which they appear in the resulting Analytics table. If you delete a detail field during the definition process, and then re-add it, it loses its original position and is placed last among detail fields. Detail fields remain together, regardless of any internal reshuffling.
Tip
If you use an initial detail field to capture detail records, but you do not want the field to appear first in the resulting Analytics table, you can use the field to capture records, and then delete it and re-add it.
Header and footer fields appear in the resulting Analytics table in the order in which you define them. They appear before detail fields if you have not defined an initial detail field, and they appear after detail fields once you have defined an initial detail field.
You also have the option of reordering fields once you have finished importing the print image or PDF file into Analytics. You can drag columns to reorder them in a view. You can also extract by view if you want to create a new table in which the fields in the table layout are physically reordered. For more information, see Extracting data. You may find reordering fields in Analytics is easier than trying to maintain a precise field order in the Data Definition Wizard.
Analytics may auto-define a file
Analytics may auto-define a print image or PDF file if it can identify recurring patterns in the data. If the initial appearance of the source file in the Data Definition Wizard includes aqua-blue field definitions and gray record definitions, then Analytics has either partially or fully auto-defined the file.
If you check the field and record definitions throughout the file and you judge the auto-definition to be complete and accurate, the work of defining the file is largely complete. You can proceed to the next page in the Data Definition Wizard.
Frequently, Analytics’s auto-definition is not completely accurate and you need to decide which is easier: editing the auto-definition, or deleting the entire auto-definition and starting a manual definition from scratch. You can delete and start over at any point, so you may want to try some editing initially, and then if it becomes apparent that the auto-definition is too far away from what you require, delete it at that point.
Note
Only detail records are auto-defined. Header or footer data, if you require it, must be manually defined.
Use control totals to verify the resulting Analytics table
Before beginning any data analysis, make sure you use control totals to verify that the Analytics table created from a print image or PDF file contains all the data present in the source file. An incomplete Analytics table will render any analysis you do invalid.
To verify an Analytics table using control totals:
-
Do one of the following:
- If the records are grouped in the source file, classify or
summarize the Analytics table to group the records in the same
manner.
When you classify or summarize, select Subtotal Fields that match one or more subtotal fields in the source file.
For more information, see Classifying data, and Summarizing data.
- If the records are not grouped in the source file, total
any fields in the Analytics table that are also totaled in the
source file.
For more information, see Totaling fields.
- If the records are grouped in the source file, classify or
summarize the Analytics table to group the records in the same
manner.
-
Output the results to screen, or to a new Analytics table, and compare the subtotals or totals in Analytics with the numbers in the source file.
If all numbers are identical, you have a complete data set.
If one or more numbers are not identical, the data in the Analytics table varies from the data in the source file. If you imported subsets of data, and reassembled a complete data set in Analytics, one possibility is that duplicate records exist in the Analytics table. For information about removing duplicate records, see Remove duplicates.
If duplicate records are not the problem, you may have to redo the definition and import of the source file. If you redo the definition, make sure to check the field and record definitions carefully, to ensure you are accurately capturing the data.