Interpretations and visualizations
An interpretation is a bundled collection of filters, visualizations, and statistics based on a table in a collection. Use them to interpret and visualize results to gain a deeper understanding of the facts and insights hidden in the data.
Note
Interpretations are available in the Analysis App window.
How it works
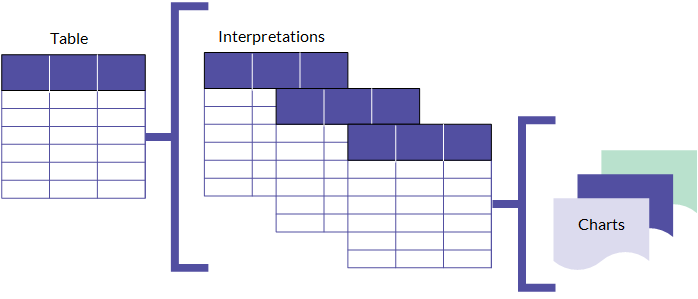
The structure of interpretations
An interpretation contains a table view of the data that you can filter, sort, or format. You can then add one or more charts to the interpretation to visualize the data in the table view.
Each chart is based on the data in the table view and any changes you make in the table view are applied to the charts as well.
Interpretations and visualizations use the table names and field names that are specified in any analytics you run, or that are specified in the Analytics project that was used to create the analysis app. You cannot change tables names or field names in an analytic, an interpretation, or a visualization. The field names you see in the Table View in the Analysis App window, and in visualizations, are display names. The analysis app also stores the physical field names. Tip To view the physical field name from the Table View, click the column header. The physical field name is listed as the Field Name value.Table and field names