Generating Excel and PDF reports
Powerful reporting and analytics tools in Diligent Evaluations let you export the results of board evaluations and assessments in just a few steps. Reports can be generated in a ready-to-present visual chart format, or as a spreadsheet that enables further data use and analysis. A variety of different types of reports are available, tailored to the different presentation and data needs that your organization may have.
Generating an Excel Report
Excel reports export the results of your evaluation to an editable spreadsheet for further data use and analysis. There are two options for Excel reports: listing responses as percentages of the total, or with the average response calculated.
-
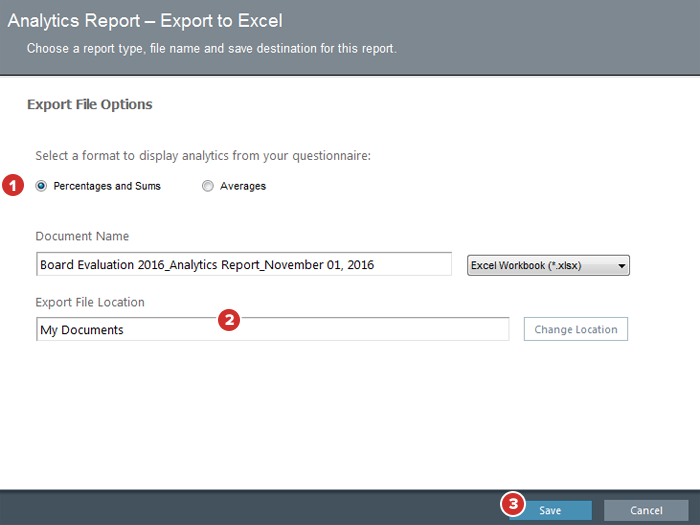
After choosing Export to Excel from the Analytics Report menu, select the type of report that you'd like to create: Percentages and Sums or Averages.
Note
The Averages report calculates average response data for participants and questions, while the Percentages and Sums report provides comparative data on responses as percentages of the whole, as well as raw numerical totals.
-
Verify and, if necessary, edit the details for your exported file using the text fields and Change Location button.
-
Select Save once your file name, save destination, and report type are correct.
-
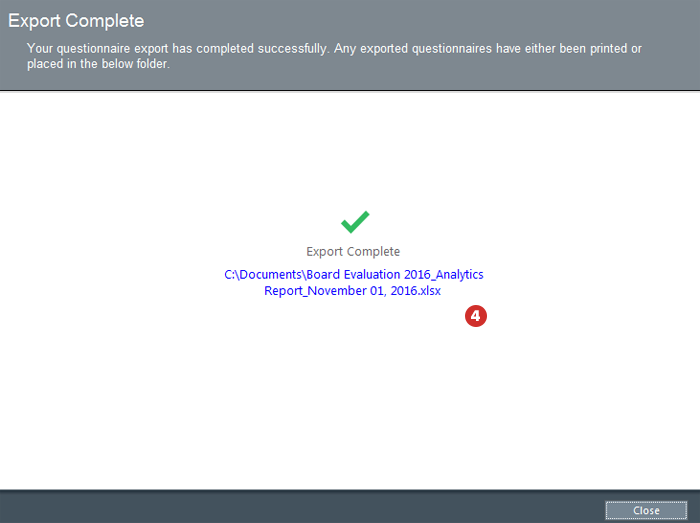
Once the export has completed, select the file path and name to view your report right away, or close the window and find the file in your designated save folder later.
Generating a PDF Report
PDF reports display the results of your evaluation in a visual chart format, ready for review and analysis. They can be generated as pie charts, bar charts, or in tabular format. All PDF reports display responses as a percentage of the total (for single-select radio button list questions), along with the raw number of participants who chose each answer (for both radio button and checkbox list questions).
-
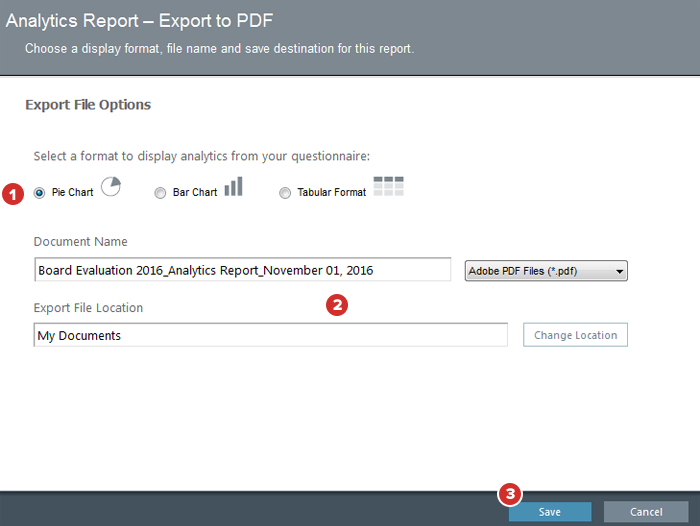
After choosing Export to PDF from the Analytics Report menu, select the type of report that you'd like to create: Pie Chart, Bar Chart, or Tabular Format.
-
Verify and, if necessary, edit the details for your exported file using the text fields and Change Location button.
-
Once your file name, save destination, and report type are correct, select Save.
-
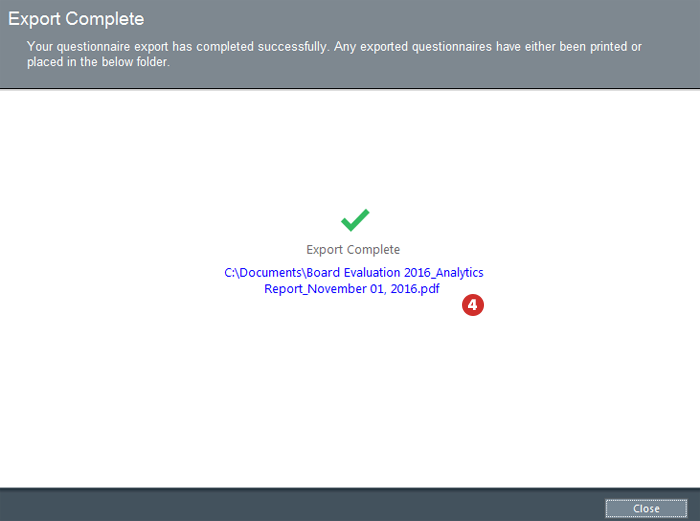
Once the export has completed, select the file path and name to view your report right away, or find it in your designated save folder later.
Did you know? If stored on a cloud-based service or unsecured server, board evaluation and assessment results are at risk of exposure. Secure File Sharing from Diligent brings world-class security to file storage and sharing. Go here to learn more.