Investor Engagement Report methodology
The Investor Engagement report uses data from Diligent Market Intelligence to help publicly listed companies quickly understand their risk to shareholder activism and approval dissent compared to their Diligent Market Intelligence derived peers. Additionally, the report highlights how CEO pay compares to the companies disclosed peers from proxy statements.
The Investor Engagement report covers the Russell 3000 index which consists of the 3000 largest companies by market capitalization representing approximately 96% of the investable US equity market.
Vulnerability methodology
The activist vulnerability data is drawn from Diligent's collective experience in reporting on activist investing, our relationships with activist investors, and our extensive background of financial data to provide an indispensable companion to our activist investing service offering.
The activist vulnerability data is calculated using DMI's proprietary model. The model, driven by a statistically significant analysis, calculates a score for each company based on specific risks that activists may target and displays a percentile ranking against your default DMI peer group.
The data in the dashboard is updated daily using the latest available data from DMI.
Companies are placed into one of three categories that evaluates a company's broad vulnerability to activism: low, moderate, and high. The percentile rank figure shows how the company ranks, in terms of vulnerability to activism, relative to the wider population of US-publicly listed and US-based companies.
The vulnerability risks consist of four primary topics:
-
Fundamentals: covering metrics related to financial health.
-
Ownership: covering metrics related to the composition of the company's shareholder base.
-
Approval: covering metrics related to approval results.
-
Governance: covering metrics related to board composition.
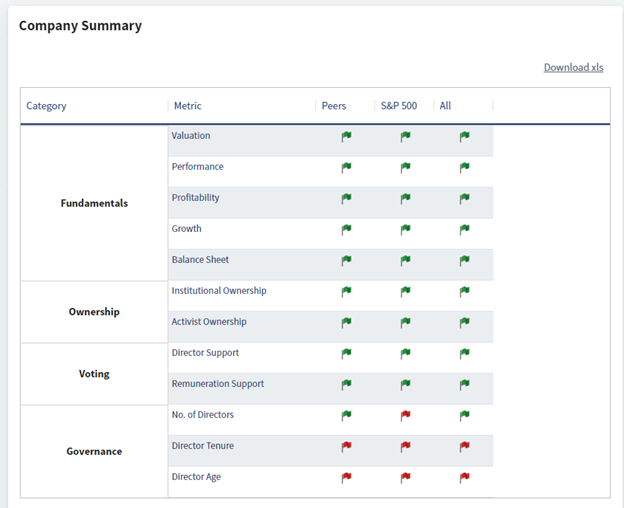
Each topic consists of the following set of 12 key categories, as shown in the image from the DMI platform below:
-
Fundamentals: Valuation, Performance, Profitability, Growth, Balance Sheet.
-
Ownership: Institutional Ownership, Activist Ownership.
-
Approval: Director Support, Remuneration Support.
-
Governance: No. of Directors, Director Tenure, Director Age.
Each category consists of several metrics which determine the category health. Each metric has its own health that cascades up to determine category health. The Activist Vulnerability Screening chart displays the proportion of all metrics within each overarching topic that are healthy or unhealthy.
The Vulnerability Factors chart displays at a category level which categories are healthy or unhealthy. Due to the varying number of metrics in each category the values in each chart may not match exactly.

Health icon calculations
Diligent highlights companies with a purple diamond or square for respective metrics, if that company falls significantly away from the median, using standard deviations, when compared with Diligent's default peer group for the company. Purple diamonds or squares highlight any areas of concern at a company on a wide range of financial metrics, including valuation, performance, profitability, growth, ownership, and others.
Peer group calculations
Diligent creates its default peer groups using a combination of the company's SIC code and market capitalization. These peer groups are used as the comparison group for all vulnerability data in the Investor Engagement Report dashboard.
For the CEO Total Granted Compensation chart, all data displayed within the chart uses data from the peer group disclosed by the company in their previous proxy statement. The chart highlights where your company is ranked for compensation amongst its default Diligent-derived peer group. The CEO Total Granted Compensation chart displays the total granted compensation for the CEO role for the most recently disclosed year but does not display realized or outstanding compensation.
Management Vote Support calculations
DMI identifies the top three shareholders based on the latest 13F disclosures from investors. DMI then analyses that investors approval disclosures to calculate the percentage of support they gave management at the last AGM with complete investor approval discloses available. This means using data from the previous proxy season for which the most recent N-PX disclosures covered. In some instances, a top three shareholder may not publicly disclosure how they responded at the AGM because the shareholders organizational structure may make them exempt from mandatory disclosure. Where a top three shareholder does not have approval data available, DMI then looks at the next highest shareholder by ownership, 4th, 5th, and so on, until DMI identifies the top three investors that have also disclosed approval data.
If the sponsor of a proposal was the company's management and the investor voted 'for' the proposal this would count as supporting management.
If the sponsor of the proposal was a shareholder and the management recommendation was to approve 'against' and the investor did approval 'against' the proposal this would also count as supporting management.
If the investor voted 'for' the shareholder proposal this would count as approval against management recommendation.
CEO Total Granted Compensation chart
This chart looks at the total amount of granted pay which is the value of all payments awarded to an individual in that particular year including base salary, STI, and LTI if converted to its dollar amount. For example, an executive may receive a long-term bonus with a value of $1,000,000 but it will not vest for another 3 years, therefore this figure appears in the total granted pay but has not been realized yet.