Managing dashboards
Diligent ESG provides dashboards so you can gain an overall understanding of your organization’s performance over time across multiple scopes and categories.
GHG dashboard
This dashboard summarizes the greenhouse gases (GHG) use of the entire organization.
-
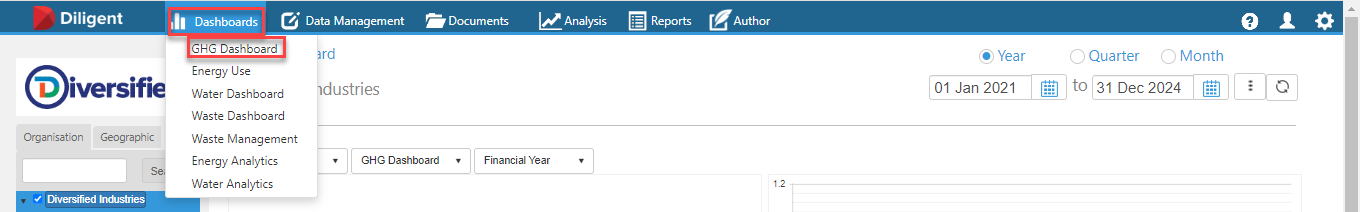
Select the Dashboards from the toolbar and select GHG Dashboard in the dropdown menu.
There are filters available to control what is displayed on the dashboard:
- Tree view select the buildings or nodes you want to view information for.
- Data Filters select Scope, Source Category, Activity type and Activity Inputs to refine data displayed.
- Date period filters the date of the data that is displayed on screen.
- Period selector filters the dashboard to display Yearly, Quarterly or monthly information.
Energy Use dashboard
The Energy Use dashboard contains charts and tables summarising the energy use in the organisation.
-
Select Dashboards from the toolbar and select Energy Use from the dropdown menu.
There are filters available to control what is displayed on the dashboard:
- Tree view select the buildings or nodes you want to view information for.
- Data Filters select Scope, Source Category, Activity type and Activity Inputs to refine data displayed.
- Date period filters the date of the data that is displayed on screen.
- Period selector filters the dashboard to display Yearly, Quarterly or monthly information.
- Dropdown menus select options to view the charts in various units including Kilowatthour, Megawatthour, and Gigajoule or time period.
Energy Analytics dashboard
You can use this dashboard to view and analyze your organization's energy use over time. If you want to request to activation of the Energy Analytics dashboard, contact the Support team.
Energy Production dashboard
Energy Generation data can be collected in the system in Energy Generation activities. Energy Generation (Electricity and/or Heat) activities do not collect emissions data. These activities are created to record solely energy data and data is collected in energy units such as Kilowatt-hour or Gigajoules. This energy may be generated on-site and consumed on-site or alternatively it may have been energy that was generated on-site and then exported/sold. The user will need to specify prior to the creation of the activity whether the energy was consumed on-site or exported/sold.
If the generation source is renewable such as Solar-PV then no emissions are required to be calculated, however the energy being produced is still recorded within the account. If the source is indicated as being non-renewable (e.g. Diesel) then the amount of diesel being combusted during this energy generation process will need to be recorded within a Scope 1 Stationary Combustion activity in order to account for the emissions.
The Energy Production Dashboard shows the energy that has been recorded within Energy Generation activities only (i.e. Electricity, Heat, Steam Cooling Generation activities), where the generation is from both non-renewable fuel sources and renewable sources.
Therefore, in certain cases, the energy generation from renewable sources (e.g. Solar-PV, Wind, Hydro) will be populated into both the Energy Use Dashboard and the Energy Production Dashboard.
If Energy is Generated and then exported from non-renewable fuel sources, then this Energy Generated data appears within the Energy Production Dashboard (while the energy usage from the combustion of the fuel still falls under the energy Use Dashboards and Reports).
-
Select Dashboards from the toolbar and select Energy Production from the dropdown menu.
There are filters available to control what is displayed on the dashboard:
- Tree view select the buildings or nodes you want to view information for.
- Data Filters select Scope, Source Category, Activity type and Activity Inputs to refine data displayed.
- Date period filters the date of the data that is displayed on screen.
- Period selector filters the dashboard to display Yearly, Quarterly or monthly information.
- Dropdown menus select options to view the charts in various units including Kilowatthour, Megawatthour, and Gigajoule or time period.
If you want to request to activation of the Energy Production dashboard, contact the Support team.
Water activities and water dashboard
There are two separate water modules to choose from:
-
Water module located within the Add New Activity screen under the Scope 3 Water icon.
-
Water Management module located within the Add New Activity screen under the Scope 3 Sustainability (CSR) Environmental icon.
The Water Management module only collects water quantity data. The Water Management module was created to assist in the further demands of water reporting required by reporting frameworks, such as GRI, CDP or DJSI, for which water sources are required to be recorded in more detail.
The Water Dashboard shows the water quantities which have been uploaded to the Water Management module activities only. These water activities only collect water quantity data as standard and therefore does not calculate emissions by default. See the available Activity Type options within this Water Management module which subsequently appear within the Water Dashboard:

The Water module currently calculates emissions factors for the following two activity types:
- Water Supply (municipal water supply)
- Wastewater Discharge (also referred to as water treatment) to publicly owned discharge facilities
These emissions factors are currently sourced from DEFRA by default.
Note
There are equivalent municipal water supply and treatment input options available in the Water Management module. These would typically be:
-
Water Supply = Water Withdrawal -> Third Party Water
-
Water Treatment = Water Discharge -> Third Party Water
The GHG Dashboard shows the water entries which have been uploaded to the Water module, as these water entries have been recorded in separate water activities which record GHG emissions data.
Water Analytics dashboard
You can use this dashboard to view and analyze your organization's water consumption over time. If you want to request to activation of the Water Analytics dashboard, contact the Support team.
Waste and Waste Management dashboards
There are two separate waste modules to choose from:
-
Waste module displays waste data on the Waste dashboard.
-
Waste Fractions module displays waste data on the Waste Management dashboard.
The Waste dashboard displays waste emissions data collected based on the DEFRA waste groupings. The Waste Management dashboard displays waste emissions data based on your organizations custom waste groupings with your own naming conventions and choice of mapping them to an associated published waste emission from DEFRA, US EPA, or custom emission factor. You can use this module to distinguish between waste groupings that are hazardous and non-hazardous. For further information about the waste module and using them, go to Managing waste data.
Generating a list of all activities and mapping IDs
When auditing or tidying-up accounts, you can generate a list of Mapping IDs available to users within the system and the activities associated with them.
-
Select Dashboards and select GHG Activities.
-
(Optional) Use the Organisation or Geographical sections to filter by region or building.
-
At the top of the list of activities, select the Export to Excel icon or Export to CSV icon.
Designing a dashboard
The dashboard charts can be designed or redesigned to a layout the user requires by following the steps below.
-
Navigate to the Dashboard Designer screen using the menu settings icon on the top right of the screen.
-
On the next screen there are three buttons to choose from: New Layout, Edit Layout, or Delete Layout.
-
To edit the dashboard select the current dashboard layout you want to edit and click Edit Layout. To design a new dashboard, select New Layout .
-
On the next screen after selecting Edit Layout the dashboard layout you are editing appears with a number of fields to complete with options, the layout is the same if you select New Layout but an empty dashboard appears.
Input fields and options:
- Module - Chart or Grid
- Chart - Bar, Line, Pie, Area, Column, Trend,
- Measure - Tonnes CO2e
- Show Intensity - Yes/No
- Group by - Time, Location, Scope, Source Category, Activity Input, Activity Input type.
- Let or Right (Chart Orientation)
-
When finished with the desired changes, click Save Layout. The new layout can now be viewed on the dashboard screen.