Getting started with ACL Robotics
ACL Robotics is a Diligent product that contains Analytics, Robots, Results, and Storyboards. This tutorial walks you through the end-to-end process of analyzing data and outputting results using Analytics, Robots, and Results.
Scenario
Classify a monthly transaction table
Every month, you need to manually classify a monthly transaction table to subtotal transaction amounts per customer.
You want to automate the work so it can run on a monthly schedule. Once automated, the manual task is performed by a machine.
Before you start
Before you start this tutorial, you must set up a Collection, an Analysis, and a Data Analytic (table) in Results. Data is stored in tables, and each table is contained within an Analysis and a Collection.
Note
The steps in this tutorial assume you have already activated Analytics, and have the appropriate read and write access to the Robots and Results apps.
Create a Collection
-
From the Platform home page (www.diligentoneplatform.com), select the Results app to open it.
If you are already in Diligent One, you can use the left-hand navigation menu to switch to the Results app.
Note
Diligent One Platform also supports the domain www.highbond.com. For more information, see Supported domains.
- From the Results home page, click Add Collection.
- On the New Collection page, name the Collection Classify a monthly transaction table, and click Create Collection.
Result The Collection Members page opens and you see the list of members who have access to the new Collection.
Create an Analysis
- At the bottom of the Collection Settings page, under What's Next?, click create your first Data Analysis.
- On the Analysis Details page, name the analysis Transactions, and click Create Analysis.
Result The Collection opens and you see the new empty Analysis that you created.
Create a Data Analytic
- On the Analysis, select Add Table > Data Analytic.
- On the Data Analytic Details page, name the Data Analytic April Transactions Classified, and click Create.
- Copy the last series of numbers after /control_tests/ in the URL, and save it in a text file.
This is the Results table ID. Once you have the table ID, click Skip this process in the Import Data page.
Result The empty Data Analytic is created.
Note
If you are using ACL Robotics Professional Edition, you are restricted to a maximum of five tables in Results.
Workflow
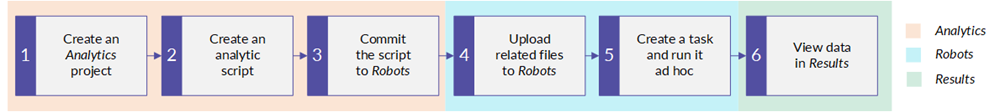
Create an Analytics project
Begin by creating an Analytics project, which is a container that stores data analysis information, including tables and scripts. Analytics projects are the highest level of organization in Analytics.
- From your computer, open ACL for Windows.
- Under Create, click Analytic Project.
- In the Save As dialog box, select a folder to save the project in, enter the file name Classify a monthly transaction table, and click Save.
Result You have created a new Analytics project.
Create an analytic script
Next, you create an analytic script in the Analytics project. An analytic script is a regular Analytics script with the addition of an analytic header required to run the script in Robots.
- In the Analytics project, from the main menu, select File > New > Script.
- Copy and paste the following script into the empty script in the Script Editor:
COMMENT
//ANALYTIC TYPE Analysis Classify_a_monthly_transaction_table
//FILE Trans_April.xls
//RESULT TABLE r_April_Transactions_Classified
//PASSWORD 1 Diligent One Access Token
END

COMMENT
*************************************************
*** Script name: Classify_a_monthly_transaction_table
*** Description: This script does the following:
*** 1 - Imports April_Transactions data
*** 2 - Classifies transactional data on customer number
*** 3 - Exports the classified table to the Results app
***
*** Written by: Your name, your organization - Today's date
*** Version: 1.0
*************************************************
END

COMMENT *** Import the Trans_April table required for review.

IMPORT EXCEL TO April_Transactions "April_Transactions.fil" FROM "Trans_April.xls" TABLE "Trans_Apr$" KEEPTITLE ALLFIELDS

COMMENT *** Classify transactional data on customer number.

OPEN April_Transactions
CLASSIFY ON CUSTNO SUBTOTAL Amount TO "r_April_Transactions_Classified.FIL"

COMMENT *** Export the classified table to the Results app.

OPEN r_April_Transactions_Classified
EXPORT FIELDS AMOUNT COUNT COUNT_PERCENTAGE CUSTNO FIELD_PERCENTAGE ACLGRC TO "XXXXXX@us" OVERWRITE PASSWORD 1
- Replace the "XXXXXX@us" placeholder in the EXPORT command with the unique Results table ID that you saved in a text file, and the appropriate code for your Diligent One region.
For example: "123456@us", or "654321@eu".
- Select File > Save to save the Analytics project.
Result You have created an analytic script.
Commit the script to Robots
Once you create an analytic script in Analytics, you upload it to a robot in the Robots app to configure the task automation that you need. The action of uploading scripts from Analytics to Robots is called committing scripts.
- In Analytics, from the main menu, select File > Commit Scripts.
- Select your organization, specify the name Classify a monthly transaction table for the new robot, and click Create.
- Enter the following commit message and click OK:
This is the initial upload of Classify_a_monthly_transaction_table, a script which is used to automate the review of transactional data.
Result You have committed the script to a robot.
Upload related files to Robots
After you commit the analytic script, you upload an Excel file to Robots. Related files are non-Analytics files, such as Excel files, that are used with scripts in a robot.
Note
To keep the tutorial simple, you will just upload an Excel file to use as script input. Typically, an analytic script imports data from a production data source such as a database.
-
From the Platform home page (www.diligentoneplatform.com), select the Robots app to open it.
If you are already in Diligent One, you can use the left-hand navigation menu to switch to the Robots app.
Note
Diligent One Platform also supports the domain www.highbond.com. For more information, see Supported domains.
- Open the Classify a monthly transaction table robot.
- In the upper-right corner of the robot, click Development to switch to development mode.
- Go to the Input/Output tab and upload the Trans_April Excel file that the script imports.
The default location for the file is: C:\Users\<user_name>\Documents\ACL Data\Sample Data Files. If the file is not on your local computer, you can first download it (Trans_April.xls), and then upload it to the Input/Output tab.
Result The related Excel file is uploaded.
Create a task and run it ad hoc
Next, you create a task containing the analytic script. When you create a task, a robot runs the selected scripts according to however you set up the task. For the purposes of viewing results immediately, you skip scheduling the task, and instead, run the task ad hoc.
- Go to the Tasks tab, and click Create task.
- Type the name Transactions Review for the task, and click Save.
- Select the Classify_a_monthly_transaction_table script
 .
. - Click
 to expand the parameter section, enter the Diligent One Access Token, and click Continue.
Note
To generate the token in Analytics, select Tools > Diligent One Access Token, enter your Diligent One credentials, and copy and paste the token into the required parameter in Robots.
- Click Continue to skip the remaining steps in the Task Designer, and click Confirm and create task to finish.
- On the Tasks tab, in the Transactions Review task, click
 > Run now.
Result The task runs. Once the task completes, you can go to the Task runs tab, and select the specific task run entry to view a summary of the outcome of a task. You can also download the result table and view it locally. This is the same results data that will be exported to Results.
View data in Results
For the final stage in the end-to-end workflow, you view the data you just exported to Results. Results is a remediation and workflow automation app. You can visualize data in Results using charts and dynamic storyboards.
-
From the Platform home page (www.diligentoneplatform.com), select the Results app to open it.
If you are already in Diligent One, you can use the left-hand navigation menu to switch to the Results app.
Note
Diligent One Platform also supports the domain www.highbond.com. For more information, see Supported domains.
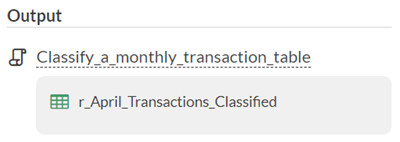
- Click the Classify a monthly transaction table collection.
- Click the April Transactions Classified table.
Result You can view the classified transactional data in Results.
Create the visualization
Now you're ready to create the visualization in Results.
-
Open the April Transactions Classified table, if it is not already open.
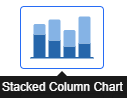
- Click Add Visualization and click the Stacked Column Chart visualization.
- In the Configure Visualization panel, select the fields and options shown below.
Note
If you can't see the Configure Visualization panel, click Configure
 .
.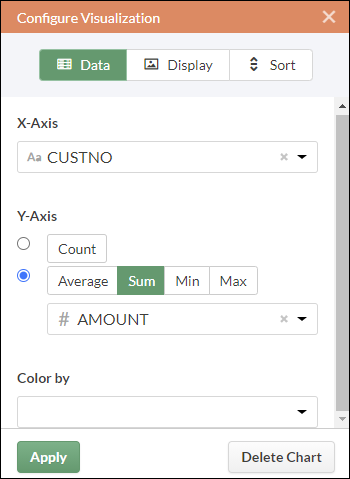
- Click Apply.
The Stacked Column Chart visualization is generated.
Save the visualization
If you want to keep any visualizations you create you need to save them. You need to save each visualization individually, and also the container that holds them, called an interpretation.
- Click Untitled at the upper-left corner of the visualization and type a title for the visualization such as Transaction Column Chart and press Enter.
- Click Save > Save As .
- In the Title field, type a name for the interpretation such as Tutorial visualizations and click Save.
The interpretation and the visualization are both saved and can be reopened later.
- Click the name of the collection, Classify a monthly transaction table, in title bar to return to the Transactions Analysis container.
-
Click the number in the Interpretations column. The Interpretations dialog box appears and notice that it lists the newly created interpretation, Tutorial visualizations.
You can create multiple visualizations and interpretations in each Analysis container. Each visualization is based on the data in the Table View.
Publish to Storyboards
Create a storyboard to display the visualization you just created. A storyboard is a communication platform that displays multiple visualizations and rich text content in a single presentation.
-
From the Platform home page (www.diligentoneplatform.com), select the Storyboards app to open it.
If you are already in Diligent One, you can use the left-hand navigation menu to switch to the Storyboards app.
Note
Diligent One Platform also supports the domain www.highbond.com. For more information, see Supported domains.
- Click Add Storyboard.
- Enter a descriptive title for your storyboard. Storyboard titles can be a maximum of 80 characters.
- Click Add
 and select Add Chart
- Select one of the following options:
- To display table view from the interpretation, select the parent table entry
 , Tutorial visualizations.
 - To display visualization from the interpretation, select the child chart entry
 , Transaction Column Chart.
You can enter a keyword or phrase into the search field to filter the list of available visualizations.
- To display table view from the interpretation, select the parent table entry
- In the upper-right corner, click Save > Save.
Recap
Let's recap the end-to-end workflow you just finished in ACL Robotics.
- You created an Analytics project, and an analytic script within the project.
- You committed the analytic script to Robots.
- In Robots, you uploaded the related Excel file, created a task containing the analytic script, and ran the task ad hoc.
- You viewed the task outcome summary in Robots, and viewed the exported data in Results.
What's next?
For an in-depth experience with ACL Robotics, see Solution guides.