Understanding project progress charts
View what project work has been completed at a high level and how much available project time is remaining.
Project progress charts
There are two available project progress charts:
| Chart name | Description | Location |
|---|---|---|
| Audit Procedures Completed | Shows what project work has been completed at a high level |
Within a project, click the Progress project management tab. |
| Time to Deadline | Shows how much available project time is remaining |
Note
The progress percentage bar ![]() on the Projects home page, and within an assurance plan, is calculated in the same way as the Audit Procedures Completed chart.
on the Projects home page, and within an assurance plan, is calculated in the same way as the Audit Procedures Completed chart.
Project Admins can hide the progress percentage bar from displaying beside each project on the Projects home page under System administration > Settings > Chart Settings.
How is project progress calculated?
Project progress is calculated using the following formula:
Sum of scores received per phase / Maximum score across all phases and objectives x 100
Objectives
Objectives are the organizing containers for work done in a project. a project can have multiple objectives.
Example objectives that form the basis of a cybersecurity project:
- Protect
- Detect
- Respond
- Identify
- Recover
Phases
Phases are the significant stages that occur in a project. An objective can have multiple phases.
All phases contribute to the project completion calculation. In order for the project completion percentage to display 100%, all phases within each objective must have a Completed status.
Example phases
- Narratives
- RCM
- Walkthroughs
- Test Plan
- Testing
- Reviews
Phase scores
Scores are determined based on the status of a phase.
| Status | Score |
|---|---|
| Not Started | 0 |
| In Process | 1 |
| Completed | 2 |
Phase statuses in detail
Statuses are based on whether specific items exist in a project and if sign-offs have been completed. As you sign off on work in a project, the project completion percentage increases.
The phases that display within objectives depend on the workflow of the project (Workplan or Internal Control), and whether or not certain phases are enabled or disabled within the project type configuration.
Workplan workflow phases and statuses
The table below lists the default phases for each objective in a Workplan workflow and describes the occurrence of each status.
Note
- Interface terms are customizable, and fields and tabs are configurable. In your Diligent One organization, some terms, fields, and tabs may be different.
- If a required field is left blank, you will see a warning message: This field is required. Some custom fields may have default values.
|
Phase |
Statuses |
||
|---|---|---|---|
| Not Started | In Process | Completed | |
| Project Plan |
displays when you add an objective and no risks or procedures have been added |
displays when an objective has one or more risks or procedures or if you update a risk or procedure after it has been cloned |
displays when the initial sign-off occurs under Project Plan-Sign offs |
| Execute Procedures |
displays when you first add a procedure |
displays when an objective has at least one procedure and you execute a procedure |
displays when the initial sign-off occurs on the Execute Procedures list (the page that displays all Execute Procedures) |
| Reviews |
displays when first you add an objective |
displays when a subsequent reviewer signs off on at least one of the following:
|
displays when all sign-off levels have been completed on all of the following:
|
Internal Control workflow phases
The table below lists the default phases for each objective in an Internal Control workflow and describes the occurrence of each status.
Note
- Interface terms are customizable, and fields and tabs are configurable. In your Diligent One organization, some terms, fields, and tabs may be different.
- If a required field is left blank, you will see a warning message: This field is required. Some custom fields may have default values.
|
Phase |
Statuses | ||
|---|---|---|---|
| Not Started | In Process | Complete | |
| Narratives |
displays when you first add a narrative or if the narratives are blank |
displays when an objective has one or more narratives and at least one narrative has not received initial sign-off OR at least one narrative has not received initial sign-off and you update at least one narrative after it has been cloned |
displays when an objective has one or more narratives and initial sign-off has occured on all narratives |
| RCM (Risk Control Matrix) |
displays when you add an objective and no risks or controls have been added |
displays when an objective has one or more risks or controls or if you update a risk or control after it has been cloned |
displays when initial sign-off has occurred on all risks and controls under Risk Control Matrix Sign-offs |
| Walkthroughs |
displays when you have not added a control or when you first add a control |
displays when an objective has at least one walkthrough and you update at least one walkthrough |
displays when initial sign-off occurs on the Walkthroughs list (the page that displays all Walkthroughs) |
| Test Plan |
displays when you first add a control |
displays when an objective has at least one test plan and you update at least one test plan |
displays when initial sign-off occurs on the Test Plan list (the page that displays all Test Plans) |
| Testing |
displays when you first add a control |
displays when you update at least one of the tests in any testing round OR when initial sign-off occurs one of the testing rounds under Testing Sign-offs |
displays when initial sign-off occurs on the Testing list (the page that displays all Tests) |
| Reviews |
displays when first you add an objective |
displays when a subsequent reviewer signs off on one of the following:
|
displays when all sign-off levels have been completed on all of the following:
|
Audit Procedures Completed chart
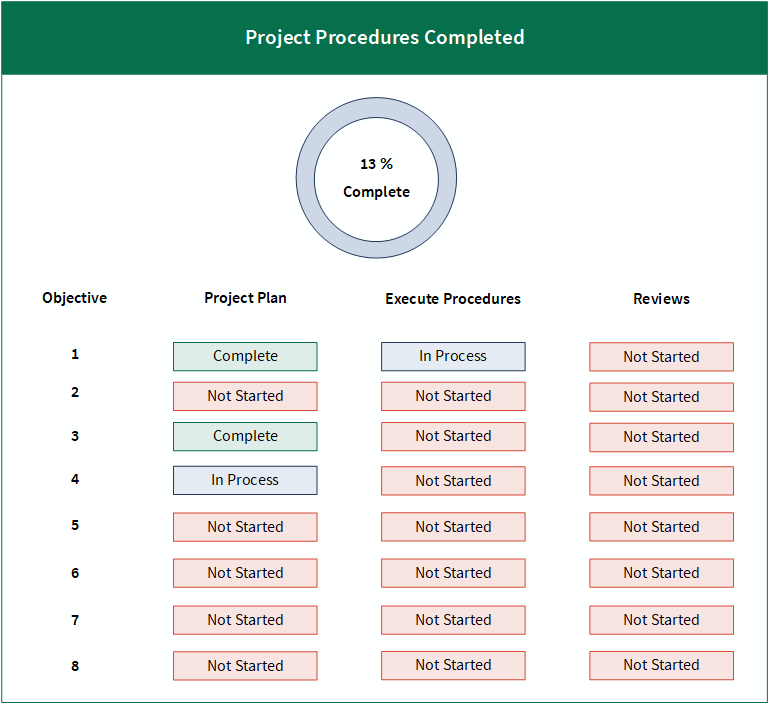
The Audit Procedures Completed chart shows what project work has been completed at a high level. It is calculated by summing the scores received per phase and dividing by the maximum score across all phases and objectives.
Note
Once you have signed off on a part of the project, it may take up to 15 minutes for the chart and progress percentage bar to update.
Example
Scenario
As an Audit Manager, you require insight into the completeness of each project phase, and the completeness of the project as a whole.
You navigate to the Project Progress page, and view the following chart. You notice that each project phase is marked by a completion status (Not Started, In Process, Complete), and an overall completion percentage is displayed to indicate the completeness of the project as a whole.
Calculation
The completed percentage is determined using the following formula:
Sum of received score / Maximum score x 100
Sum of received score
The received score for each project phase is calculated based on the values associated with each completion status:
- Not Started = 0
- In Process = 1
- Completed = 2
Sum of received score
(2+1+0) + (0+0+0) + (2+0+0) + (1+0+0) + (0+0+0)+ (0+0+0) + (0+0+0) + (0+0+0) = 6
Maximum score
The maximum score you can obtain across all project phases and objectives is determined using the following formula:
Project phase count x Maximum project phase score x objective count
Maximum score 48 (3 x 2 x 8)
| Portion of formula | Value | Remarks |
|---|---|---|
| Project phase count | 3 |
There are 3 project phases:
|
| Maximum project phase score | 2 |
The maximum score you can have for a single project phase is 2:
Note
In the case where you have a single objective with all project phases marked as Complete, this value intentionally inflates the score so that the completed percentage can equal 100%. |
| Objective count | 8 | The number of control objectives within this project is 8. |
Result
Sum of received score (6) / Maximum score (48) x 100 = 12.5.
The total percentage is rounded up from 12.5% to 13%.
Time to Deadline chart
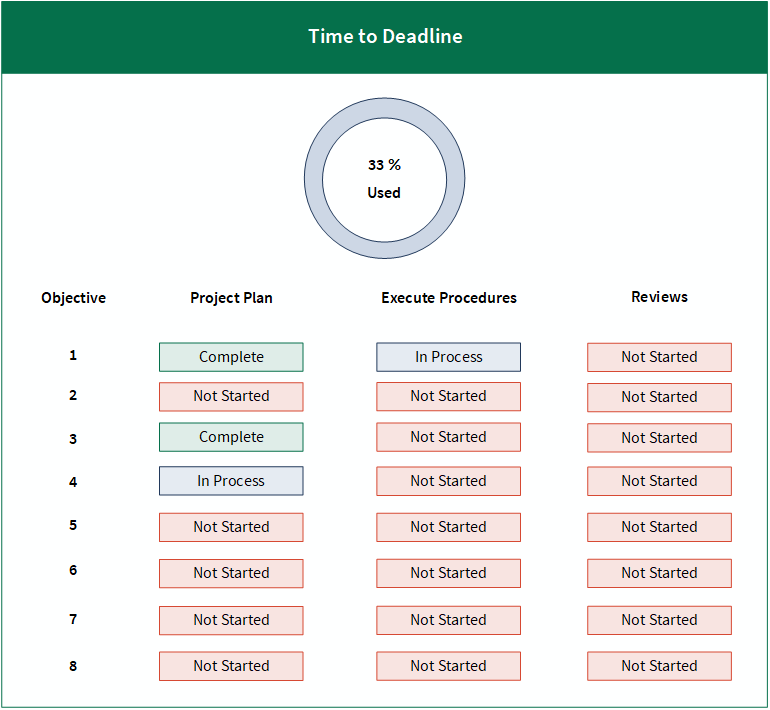
The Time to Deadline chart shows how much available project time is remaining. It is calculated by dividing the number of days that have passed in the project by the total number of calendar days.
Example
Scenario
As an Audit Manager, you require insight into the total percentage of project time used.
You navigate to the Project Progress page, and view the following chart. You notice a completion percentage that represents how much of the project time has been used.
Calculation
The completed percentage is determined using the following formula:
Number of days passed / Total number of calendar days x 100
The completed percentage is calculated using the following information:
- Fieldwork Start Date = January 1, 2020
- Target Completion Date = December 31, 2020
- Today's Date = April 30, 2020
You can view the Fieldwork Start Date and Target Completion Date under Settings.
The number of days passed in the project is 120. The total number of calendar days is 365.
Result
Number of days passed (120) / Total number of calendar days (365) x 100 = 32.876712328
The total percentage is rounded up to 33%.