Meter charts in Reports
Meter charts display a single variable, and may use colors to indicate whether the current value is in the regular, warning, or critical range.
Available charts
| Icon | Chart name | Description |
|---|---|---|
|
|
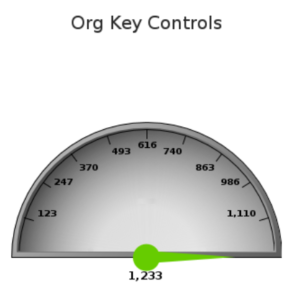
Meter | measures the rate of change against pre-defined targets |
|
|
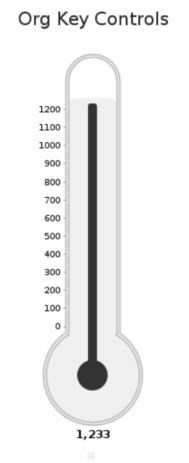
Thermometer | a vertical representation of a meter chart that indicates a range of qualitative indicators |
|
|
Dial | used to communicate KPIs (Key Performance Indicators) |
When do you use them?
Meter charts are useful for dashboard reporting as they clearly indicate the measurement of a single variable against pre-defined targets.
Examples
Your organization is tracking project data and needs to determine the total number of key controls in the organization. Using a meter, you clearly demonstrate the number of key controls in the organization:
Your organization is tracking project data and needs to determine the total of key controls in the organization. Using a thermometer, you clearly demonstrate the number of key controls in the organization:
Your organization is tracking project data and needs to determine the total of key controls in the organization. Using a dial, you clearly demonstrate the number of key controls in the organization:
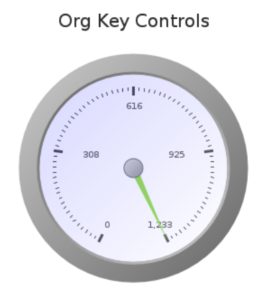
Chart configuration settings
Depending on the meter chart selected, settings may vary.
The Reports interface prevents you from using data types that are unsupported and from building charts that do not include the mandatory settings.
On the Chart tab, configure the following settings:
| Setting | Description |
|---|---|
| Measure |
the series to be used for measurement |
| Target | a numeric field that defines a set goal |
| Tool Tip |
the label to be displayed when you roll over your mouse on specific data points |
| Animation |
the datetime field used to animate the chart Each value of the animation field generates a unique frame in the animation. Note
To provide a label for each frame, format the chart title to display the animation field. |
| Auto Refresh |
turned on by default If you turn off this setting, you disable the chart preview and stop querying the database after each field change. |