Statistics
Statistics provide an overview of the data in a table that you can use to identify trends or irregularities.
Data configuration settings
When you configure statistics, you select one or more table fields to use. If any filters are applied to the selected fields, the calculations reflect these filters.
Note
Statistics are not available in storyboards.
Calculation terms per data type
| Data type of field | Term | Definition |
|---|---|---|
| Numeric | Count | The total number of records in the current table view |
| Positives | The number of positive values in the field, displayed in green | |
| Negatives | The number of negative values in the field, displayed in red | |
| Zeros | The number of zero values in the field | |
| Total | The total of the values in the field | |
| Average | The average of the values in the field | |
| Range | The difference between the highest and lowest values in the field | |
| Standard Deviation | The standard deviation from the average value | |
| Highest | The five highest values in the field | |
| Lowest | The five lowest values in the field | |
| Datetime | Range (in days) | The number of days between the most recent date and the earliest date in the field |
| Standard deviation (in days) | The standard deviation, measured in days, from the average date | |
| Count | The number of non-blank dates in the field | |
| Blanks | The number of blank dates in the field | |
| Most Recent | The five most recent dates in the field | |
| Earliest | The five earliest dates in the field | |
|
Character |
Unique Values |
The number of unique values in the field. One or more blank values count as 1 unique value |
| Blanks | The number of blank values in the field |
Example
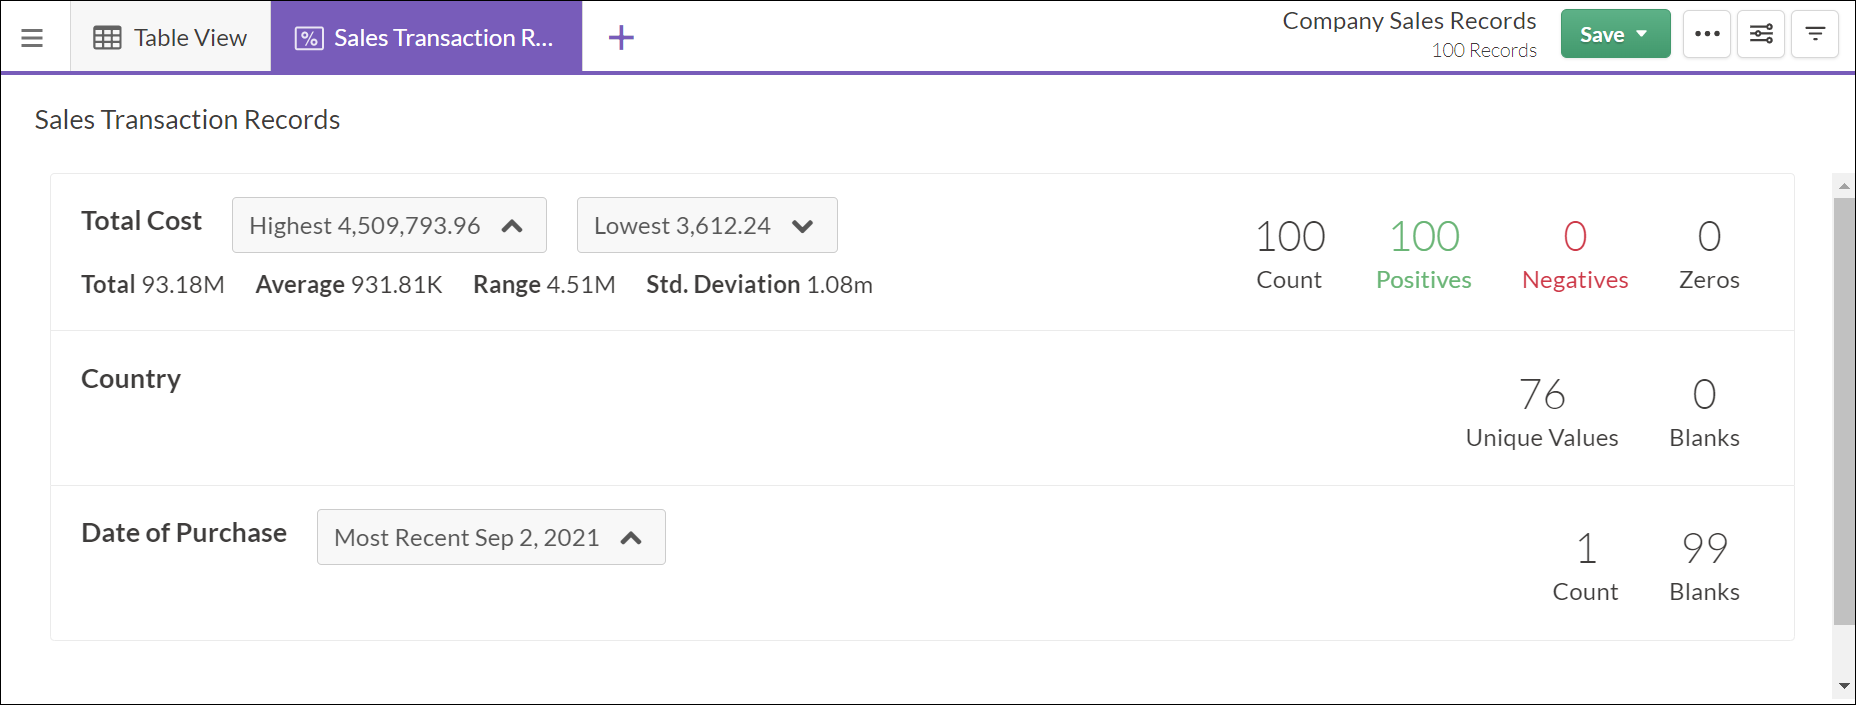
Statistics for numeric, datetime, and character fields
The following Statistics visualization provides calculations for:
- Total Cost numeric
- Country character
- Date of Purchase datetime