Visualizing risk
Visualize risk to gain a deeper understanding of the facts and insights hidden in the data.
How it works
There are two options for visualizing risk within the Strategy app.
- The Strategy Heatmap identifies the location of clusters of risk in your company. It shows the aggregation of risk in individual areas of your company, indicating where you should focus your mitigation. There is only one Strategy Heatmap and you cannot delete it.
- Risk Heatmaps identify the relative severity of risk in your company. There is a default Risk Heatmap, which you cannot delete, but you can also create your own.
Strategy Heatmap
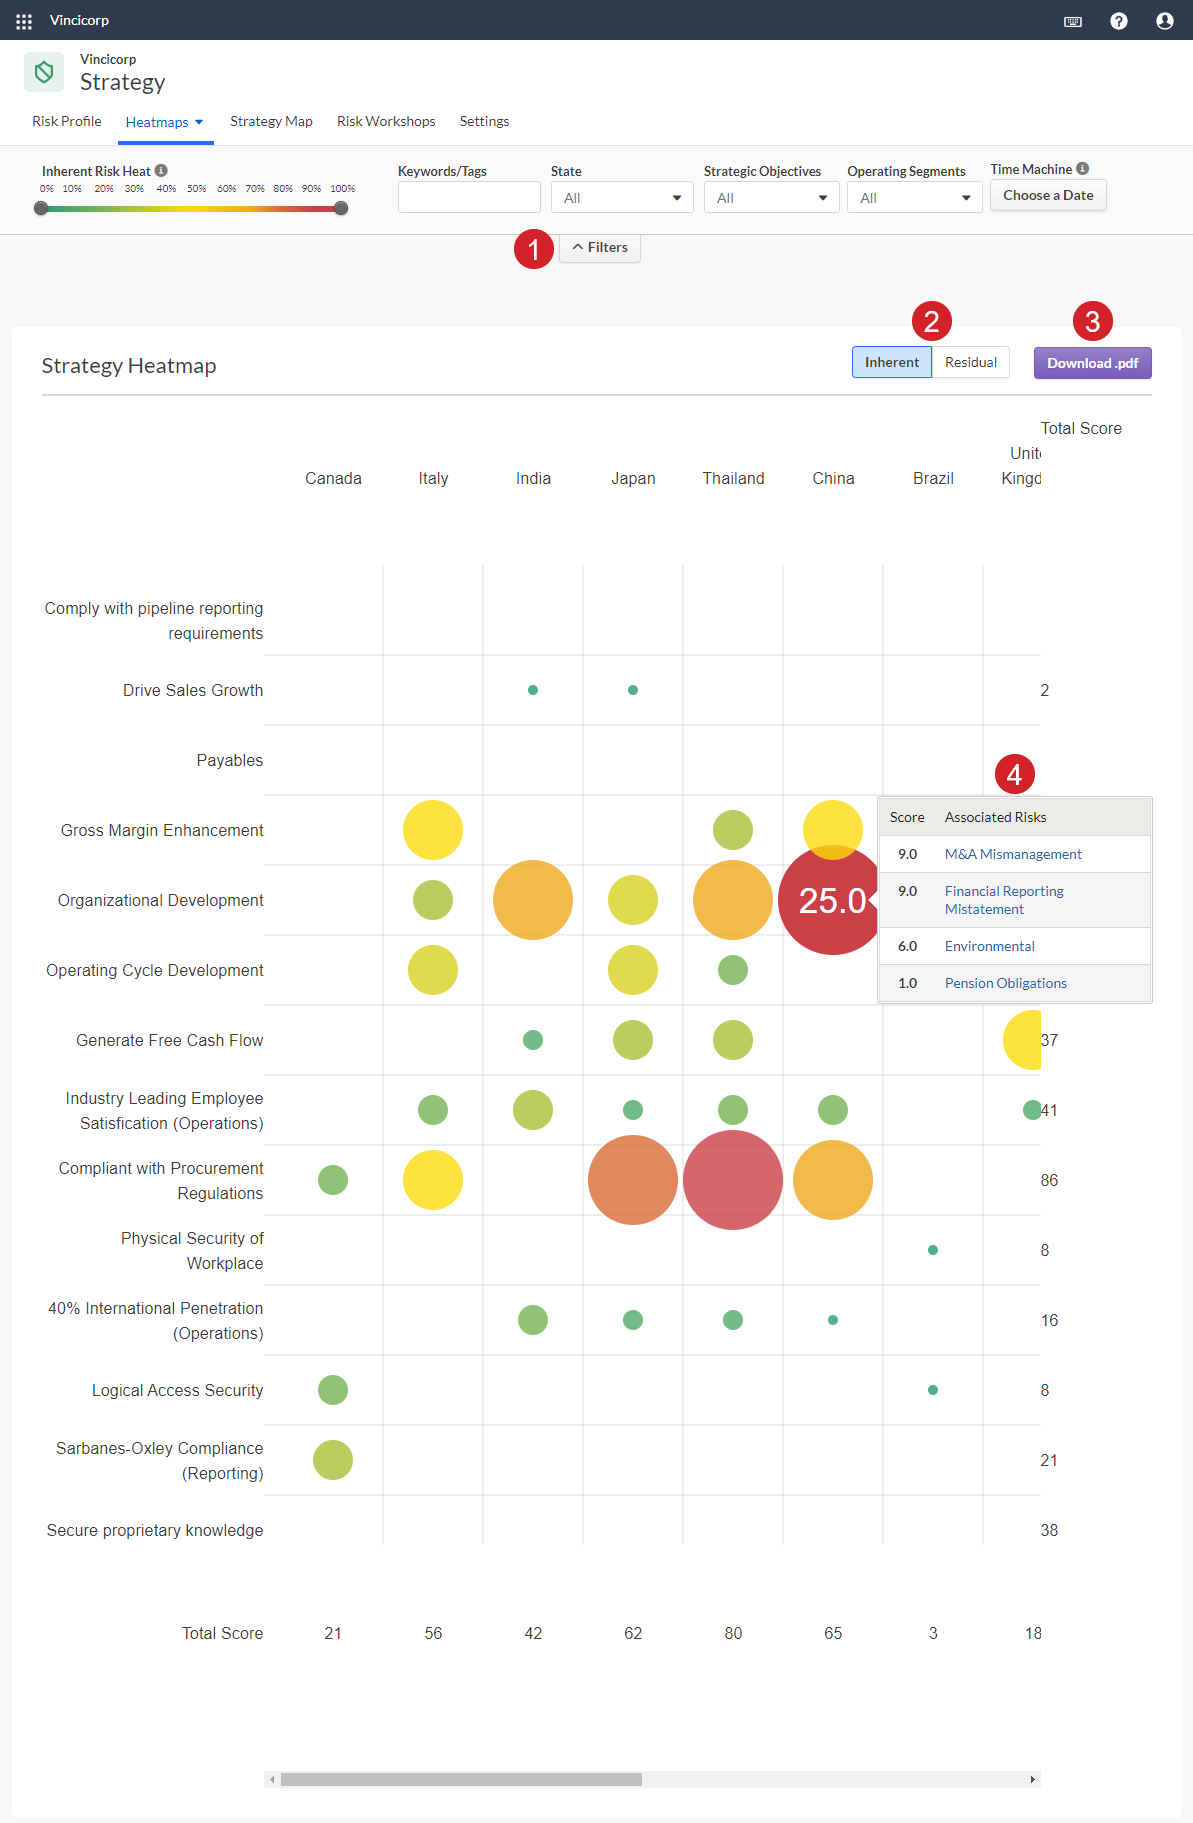
The Strategy Heatmap identifies the location of clusters of risk in your company. It shows the aggregation of risk in individual areas of your company, indicating where you should focus your mitigation. The Strategy Heatmap can display inherent or residual risk, but not both at the same time. There is only one Strategy Heatmap and you cannot delete it.
- The size of each bubble indicates the volume of clustered risks.
- The color of each bubble indicates the severity of clustered risks for each operating segment or strategic objective combination.
- The Total Score column displays the total inherent or residual risk score for each operating segment.
- The Total Score row displays the total inherent or residual risk score for each strategic objective.
Note
- Interface terms are customizable, and fields and tabs are configurable. In your Diligent One organization, some terms, fields, and tabs may be different.
- If a required field is left blank, you will see a warning message: This field is required. Some custom fields may have default values.
Components
| Number | Component | Description |
|---|---|---|
| 1 | Filters |
|
| 2 | Inherent or Residual | Choose whether the Strategy Map displays inherent (unmitigated) or residual (mitigated) risk. |
| 3 | Download PDF |
Export the Strategy Map to .pdf. Applied filters are saved and reflected in the PDF. |
| 4 | Associated risks |
Click on an individual bubble to see the risks and scores associated with it. You can drill down to learn more about specific risks. |
Risk Heatmap
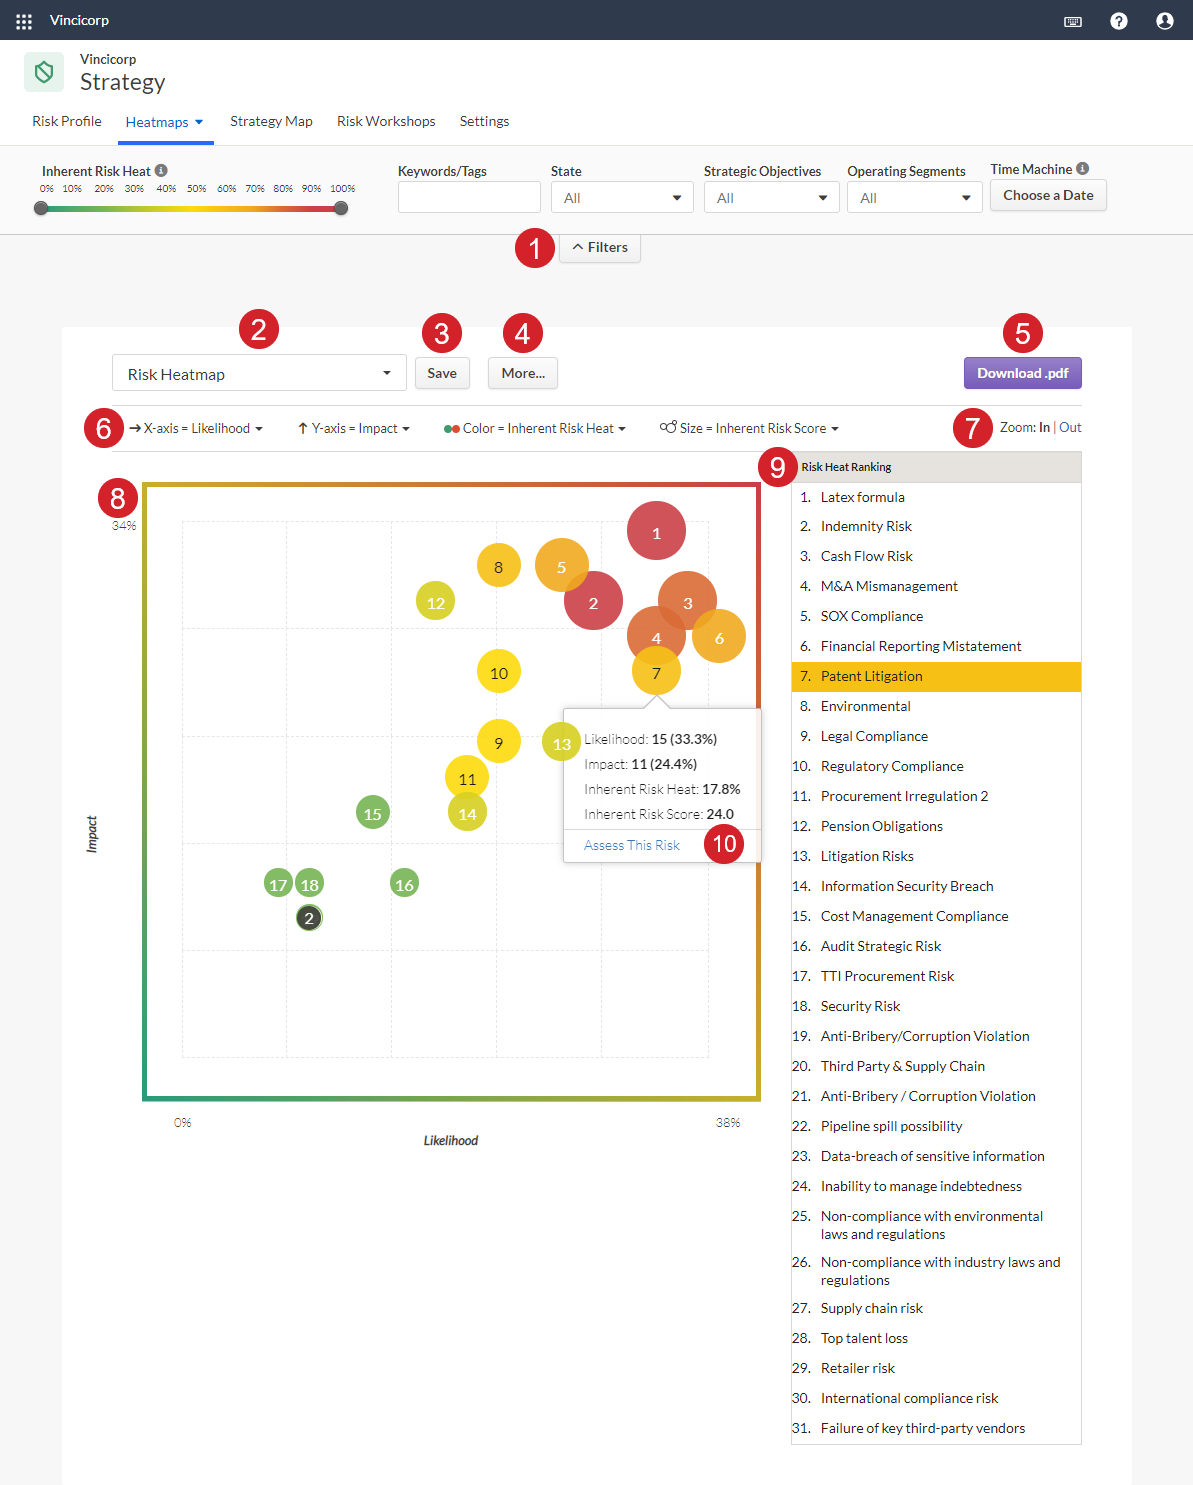
Risk Heatmaps identify the relative severity of risk in your company. There is a default Risk Heatmap, which you cannot delete, but you can also create your own.
Note
- Interface terms are customizable, and fields and tabs are configurable. In your Diligent One organization, some terms, fields, and tabs may be different.
- If a required field is left blank, you will see a warning message: This field is required. Some custom fields may have default values.
Components
| Number | Component | Description |
|---|---|---|
| 1 | Filters |
|
| 2 | Risk Heatmap selector | defines which Risk Heatmap to view or configure |
| 3 | Save | saves the Risk Heatmap |
| 4 | More ... | saves a new Risk Heatmap, renames a Risk Heatmap, or deletes a Risk Heatmap |
| 5 | Download PDF |
exports the Risk Heatmap to .pdf Applied filters are saved and reflected in the PDF. |
| 6 | Dimensions | defines the values for the X-axis, Y-axis, color of the bubbles, and size of the bubbles in the visualization |
| 7 | Zoom | change the scale of the x and y-axes on risk heatmaps |
| 8 | Visualization | allows you to view the aggregation of risks in individual areas of your company |
| 9 | Risk Heat Ranking |
ranks risks from highest to lowest based on the combined Likelihood and Impact values for each risk If the inherent risk score is the same for two or more risks within the list, the risks are ordered by inherent risk heat. If the inherent risk score and inherent risk heat is the same for two or more risks, the risks are ordered by risk ID in ascending order. |
| 10 | Assess This Risk | allows you to view the aggregation of risks in individual areas of your company |