Sharing findings with anyone using storyboards
Objectives
- Describe the value of storyboards
- Add a visualization to your storyboard
- Add a metric to your storyboard
- Finalize your storyboard by adding text that describes your visualizations and metrics and gives context to your audience
- Share your storyboard with anyone so you can visually communicate your results to all stakeholders!
Background
You've been busy creating visualizations and metrics to communicate your Pcard program exceptions. Sharing this information with Pcard program and compliance stakeholders is critical, but not everyone in your organization has access to Results and Storyboards. You also don't think navigating to each visualization and metric is the most effective (or time-saving!) way to tell the story of your data.
You need a way to share your findings in a consolidated, accurate view with all the necessary people across your organization. If you could find a way to do this and ensure these reports are always up-to-date so everyone can make decisions based on the same, current data... well, that sounds like a sure way to stand out from the crowd - for all the right reasons.
Overview
Storyboard, you say?
So you're now a pro at creating pretty nifty visualizations and metrics, and you want to be able to share them with the powers that be. You'd like to incorporate a few visualizations and metrics in one location to create a meaningful story that will convey all the important information you've gathered from your analysis: Enter the aptly named storyboard to the rescue.
A storyboard that you've carefully crafted will display your visualizations and metrics. On top of this, you can add text to provide a bit of context so that anyone who looks at your storyboard can read your story. You could create the nicest looking visualizations, but they won't be of much use if your audience doesn't understand what they're intended to communicate!
Why should I use storyboards?
Storyboards can be applied in many different contexts and across a wide range of industries and even departments. The possibilities for what stories you could tell are limitless. What all these possibilities have in common is the underlying reason for creating any storyboard: making your message hit home so that you have the buy-in to enact change. It also doesn't hurt that sharing this kind of key information will help make you the most sought-after player in your organization.
You step back a moment from your audit and jot down a number of potential storyboard uses because that's how much of a visionary you are!
|
Potential story to tell with your storyboard |
Recommendation or change you'd want to enact |
|---|---|
|
Lack of IT security certifications for your third-party vendors |
Increase security certifications for third-party vendors and protect confidential company information |
|
Suspicious travel and expense transactions by merchant, date, and amount |
Automate travel and expenses policy education and follow-up procedures in order to separate false positives from actual violations |
|
Control deficiencies in financial processes |
Provide training for the Finance Team on potential control failures and measure impact or success of training initiative |
|
Internal controls testing and manual processes related to SOX compliance |
Automate SOX and control testing to decrease manual workload and save time and money |
Adding visualizations, metrics, and text
Once you start working on your new storyboard, you have the option of adding visualizations and metrics (that you created in Results) to a storyboard. You can add up to three of these items per row along with an unlimited number of rows, so you have plenty of ways to tell your story about your latest security review.
Watch the video below to see how to get started with creating your first storyboard:

Sharing your storyboard with anyone
Once you've created a storyboard, you have the capability of sharing it with anyone! That's right - anyone! You can even share it with folks who don't have a Diligent software subscription.
Save your storyboard before you share it.
After you've named, designed, and saved your storyboard, you can generate a link that can be sent to and viewed by anyone. Even if you make changes to your storyboard, the initial link you generated will still be up to date with ALL your latest changes.
Approach
- It's time to get noticed across your organization for all the right reasons. Start building your first storyboard so you can effectively communicate the story of your data.Creating a new storyboard

- Open the app switcher
 and select Storyboards.
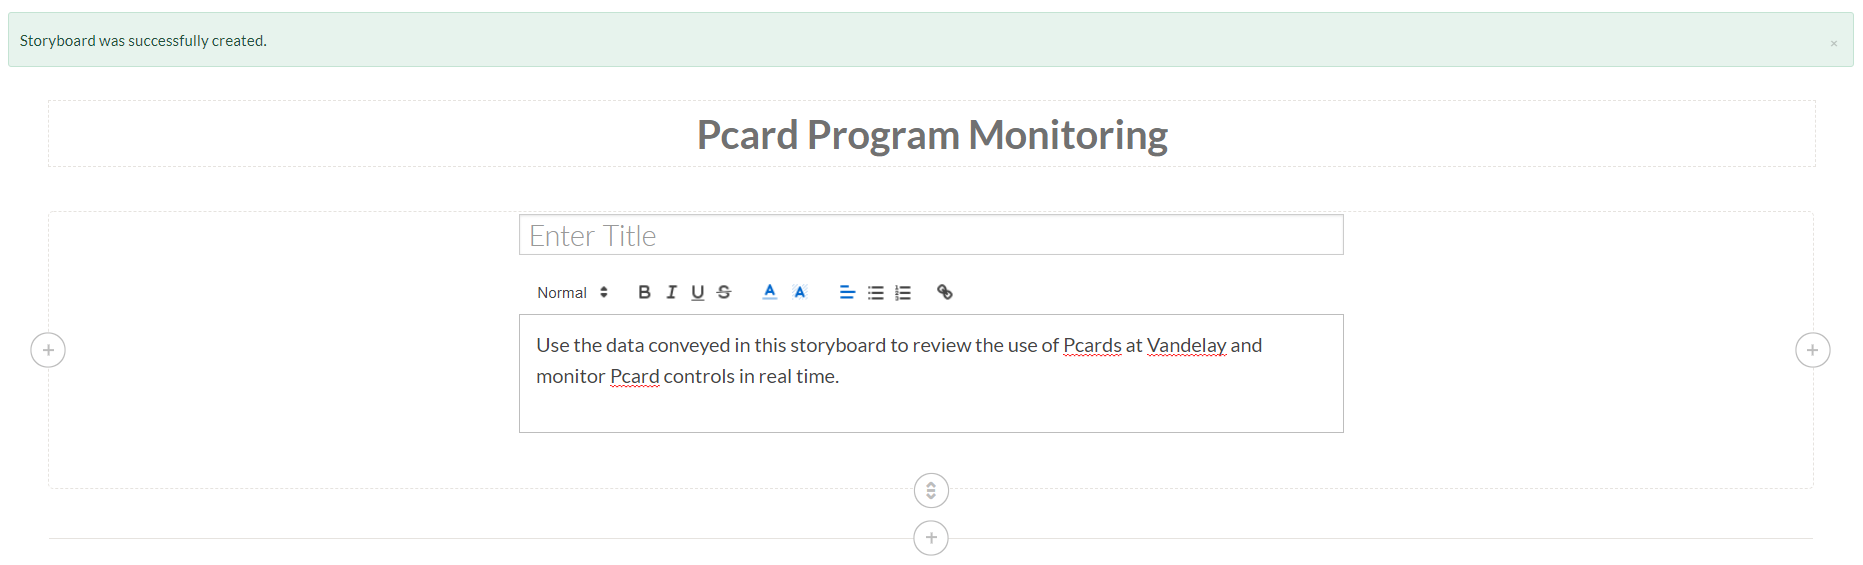
The Storyboards homepage opens. - Click +Add storyboard and enter your storyboard name: Pcard Program Monitoring.
- Add text to introduce your storyboard so anyone looking at it for the first time knows what it's communicating:
- Click the Add
 icon to add text to your storyboard.
 - Click Add Text
 .
. - Enter something similar to the following text:
Use the data conveyed in this storyboard to review the use of Pcards at Vandelay and monitor Pcard controls in real time.
- Click the Add
- Open the app switcher
- You want to make sure your storyboard communicates information around employee Pcard violations and how these exceptions are being remediated.
Communicating employee Pcard violations
- Add text to give context to the metric and visualizations you're about to add:
- Click the Add icon below the introductory text you just added to add more text to your storyboard.
- Click Add Text .
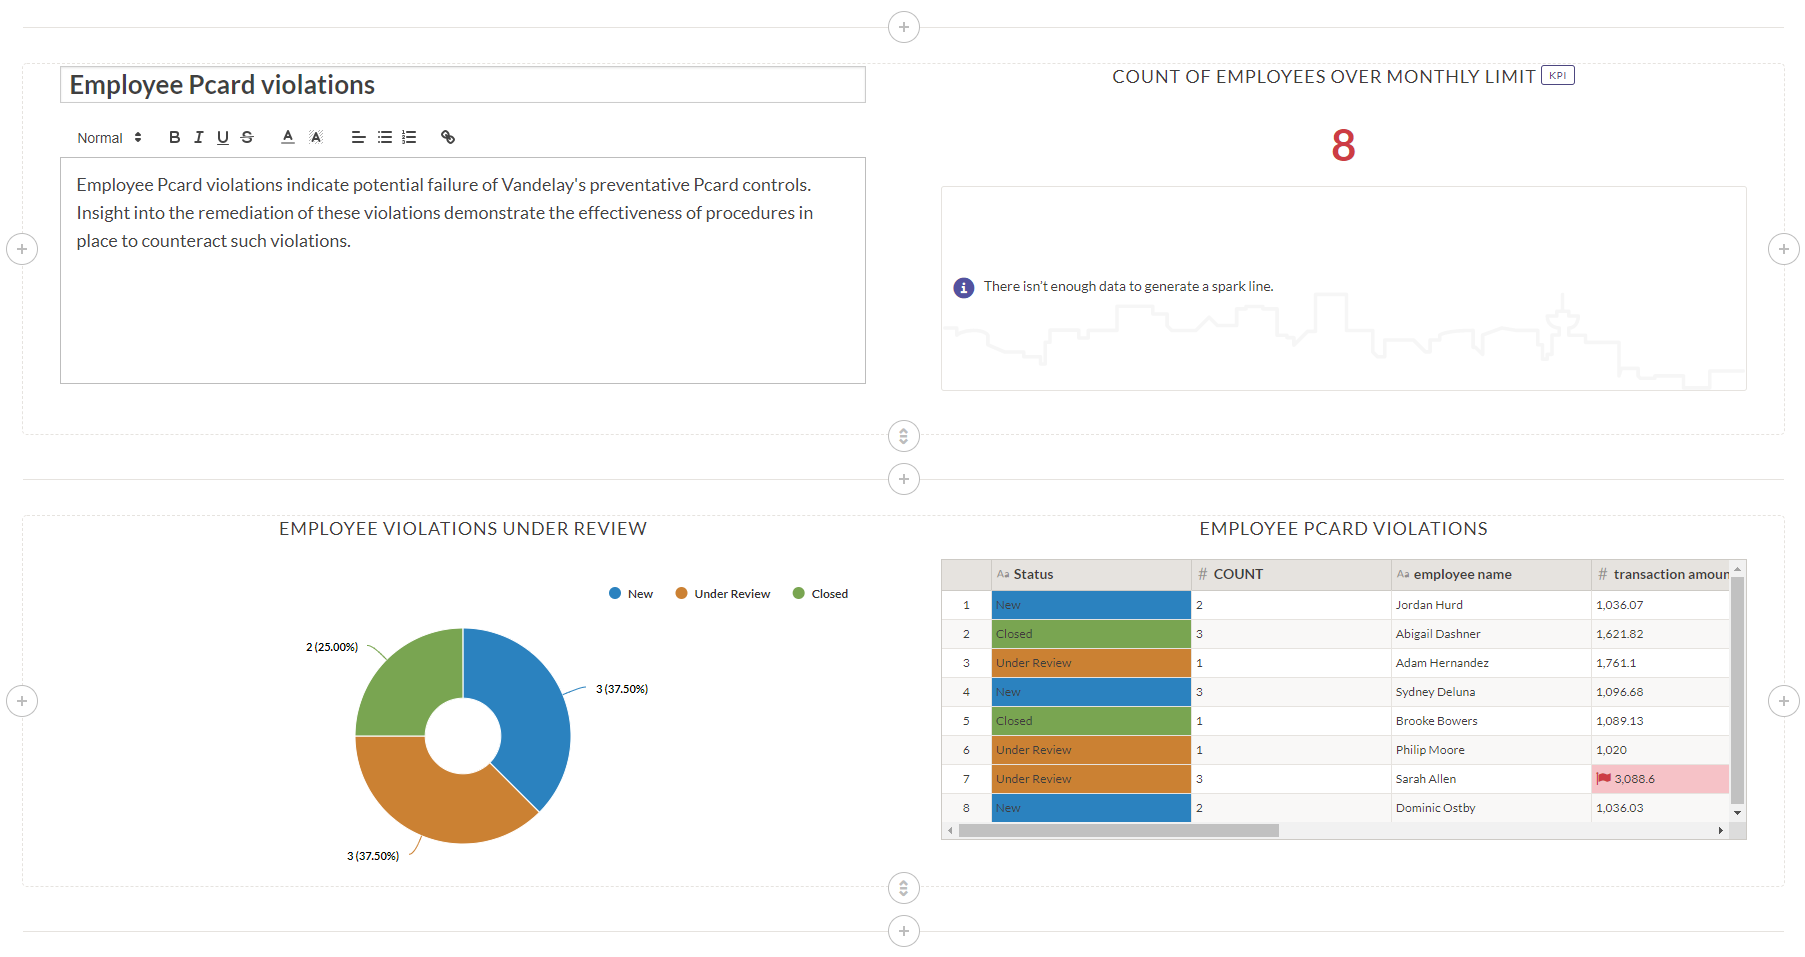
- Enter a title in the Enter Title box: Employee Pcard violations.
- Enter a description in the main text box:
Employee Pcard violations indicate potential failure of Vandelay's preventative Pcard controls. Insight into the remediation of these violations demonstrate the effectiveness of procedures in place to counteract such violations.
- Click the Add
- Add the Count of employees over monthly limit metric:
- Click the Add icon to the right of the text you just added.
- Click Add Metric
 .
.
The list of metrics you've created across your entire Vandelay training org appears. The metrics are grouped by collection. - Navigate to the PROCUREMENT CARD REVIEW collection section and select the Count of employees over monthly limit metric.
The metric is added to your storyboard.Tip
You can also search for a specific metric in the Search for metric field at the top of the list. Entering a keyword in this search bar filters the metrics so you can more easily find the one you want to add to your storyboard.
- Click the Add
- Add the Employee violations under review visualization to your storyboard.
- Click the Add icon below the text and metric you just added.
- Click Add Chart
 .
.
The list of visualizations you've created across your entire Vandelay training org appears. The visualizations are grouped by collection. - Navigate to the PROCUREMENT CARD REVIEW collection section and select the Employee violations under review visualization. Note
Notice the icon next to the Employee violations under review visualization? Depending on the type of visualization, you'll see a visual representation of it next to the chart name. In this case, .
.
- Click the Add
- Add the Employee Pcard violations table to your storyboard.
- Click the Add icon to the right of the visualization you just added.
- Click Add Chart .
- Navigate to the PROCUREMENT CARD REVIEW collection section and select the Employee Pcard violations table
 .
.
- Click the Add
- Add text to give context to the metric and visualizations you're about to add:
- You also want to present total Pcard transactions data. It would be enlightening for key stakeholders in the Pcard program to visualize data, such as:
- the location where most Pcard transactions are occurring
- the most-purchased-from merchants
- Add text to give context to the metric and visualizations you're about to add:
- Click the Add icon below the visualization and table you just added.
- Click Add Text .
- Enter a title in the Enter Title box: Total Pcard transactions.
- Enter a description in the main text box:
Use this information to gain insight into how Vandelay's Pcard program is operating. If certain locations or certain merchants are seeing excessive purchases (more than $50,000 per year), you may need to investigate.
- Click the Add
- Add the Transaction total by location visualization:
- Click the Addicon to the right of the text you just added.
- Click Add Chart .
The list of visualizations you've created across your entire Vandelay training org appears. - Navigate to the PROCUREMENT CARD REVIEW collection section and select the Transaction total by location visualization.
The visualization is added to your storyboard.
- Click the Add
- Add the Merchants by total and count of transactions visualization to your storyboard.
- Click the Add icon below the text and visualization you just added.
- Click Add Chart .
The list of visualizations you've created across your entire Vandelay training org appears. - Navigate to the PROCUREMENT CARD REVIEW collection section and select the Merchants by total and count of transactions visualization.
- Click the Add
- Save your work and then share it with anyone, regardless if they're a HighBond user or not.Saving and sharing your new storyboard
- Save your storyboard:
- At the top-right of the page, click Save.
- Turn Edit mode off by switching the toggle off.
- Share a link to your storyboard with non-HighBond users:
- From the Storyboard, in the top right-hand corner, click Share Storyboard
 .
. - In the Storyboard Sharing panel, click Link.
- To create a link when none exists, click Generate Link.
- Click the clipboard
 icon to copy the URL.
 - Paste the URL and send it on to anyone you want to share your storyboard with.Note
Want an idea of how this link will appear to others when they click it? View the following storyboard link to see for yourself: https://training-9c845e.results.highbond.com/storyboard_links/koyqBv942WnexzTLGa38
- From the Storyboard, in the top right-hand corner, click Share Storyboard
- Present your storyboard in presentation mode:
- In the top-right corner of the Storyboard, click Presentation . The storyboard opens in a new tab of the browser. Each tile of the storyboard is displayed on a single slide, starting with the title.
- Use the arrow keys or forward and back icons to move between slides.
- To get back to Results, close the presentation mode tab.
Tip
The forward and back icons are located in the bottom-right corner.
- Save your storyboard: