Example
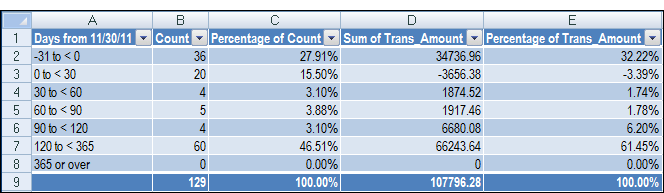
You are working with an accounts receivable table and you need to find the total number of transactions for each aging period. To find this, you age the data using the due date field and subtotal the transaction amount column.
In your results, you see the total number of transactions per aging period and the total transaction amount per period.