Classifying data
Classifying groups the records in a table based on identical key field values, and counts the number of records in each group. Key fields can be character or numeric.
For example, you could classify a transactions table on the customer number field to find the total number of transactions for each customer.
In the example below, there are ten values in the Customer Number field in the input table. Some values are unique, and some values are identical. After summarizing, the values are grouped into four unique groups. The Count tells you how many records, or transactions, are in each customer number group.
| Input table | Output results | |
|---|---|---|
| Key field: Customer Number | Classified group | Count |
| 795401 | 230575 | 1 |
| 518008 | 518008 | 5 |
| 518008 | 795401 | 3 |
| 925007 | 925007 | 1 |
| 518008 | ||
| 795401 | ||
| 518008 | ||
| 230575 | ||
| 795401 | ||
| 518008 | ||
Subtotaling associated numeric fields
When classifying, you can optionally subtotal one or more associated numeric fields. In the example above, you could subtotal the transaction amount field to find the total transaction amount for each customer.
Classifying and sorting
You can classify sorted or unsorted tables. When you classify an unsorted table Analytics automatically sorts the output results as part of the classify operation.
Classifying unsorted tables requires Analytics to create a variable for each set of identical values in the key field and store these variables in memory until the entire table is read. If you are working with a large table, storing the required variables requires a lot of RAM and can be slow.
The Statistics option
The Include Statistics for Subtotal Fields option allows you to calculate average, minimum, and maximum values for any subtotal field you specify. The results of the calculations are broken down by group in the classified output table.
In the example above, the statistics option would calculate the average, minimum, and maximum transaction amounts for each customer.
Classifying in detail
Classifying performs the following operations:
|
Operation |
Location in Classify results |
|---|---|
|
Groups the records based on identical values in a character or numeric field |
Product Class field |
|
Counts (subtotals) the number of records for each group, and calculates the percentage of the total count represented by each subtotal |
Count field Percent of Count field |
|
Optionally subtotals the values of one or more numeric fields for each group, and for the first selected numeric field calculates the percentage of the total value represented by each subtotal |
Inventory Value at Cost field Percent of Field field |
|
Optionally calculates average, minimum, and maximum values for each subtotaled numeric field |
not shown |
|
Provides totals for all numeric fields included in the output results |
Totals row |
|
Optionally breaks down the output results based on the values in a character field such as customer ID or transaction type (requires that the character field is sorted prior to classifying) |
not shown |
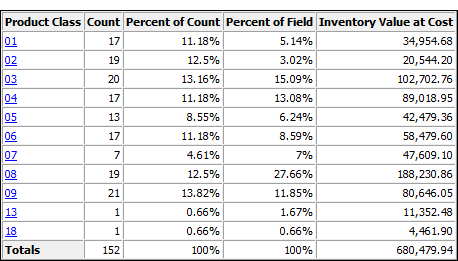
Classify results
Output results produced by:
- classifying on product class
in an inventory table
(the Inventory table in ACL DATA\Sample Data Files\Sample Project.ACL)
- subtotaling inventory value
- outputting the results to screen
The results show that the inventory value is concentrated in four product classes: 03, 04, 08, 09.
Steps
You can classify data by grouping the records in a table based on identical values in a character or numeric field.
For each group, you can optionally include the following calculations for associated numeric fields: subtotal, average value, minimum value, maximum value.
Note
Classifying supports a maximum key field length of 2048 characters.
If you want to classify a table using a key field longer than 2048 characters, you can summarize, which does not have a length restriction. For more information, see Summarizing data.
If you classify a larger data set and output the results to screen or graph, you may exceed available memory. You can reduce memory usage when outputting to screen by selecting Suppress XML Output for Command Results (Tools > Options > Command).
- Select .
- On the Main tab, do one of the
following:
Select the field to classify from the Classify On drop-down list.
Click Classify On to select the field, or to create an expression.
-
Optional. Select one or more Subtotal Fields, or click Subtotal Fields, to select the subtotal field(s), or to create an expression.
The order in which you select the subtotal fields is the order in which the columns appear in the results. If you are appending results to an existing Analytics table, the column selection and order must be identical to the column selection and order in the existing table.
-
If there are records in the current view that you want to exclude from processing, enter a condition in the If text box, or click If to create an IF statement using the Expression Builder.
Note
The If condition is evaluated against only the records remaining in a table after any scope options have been applied (First, Next, While).
The IF statement considers all records in the view and filters out those that do not meet the specified condition.
-
Optional. Select Include Statistics for Subtotal Fields if you want to calculate average, minimum, and maximum values for each subtotaled numeric field.
You must select at least one subtotal field in order to include statistics.
- Click the Output tab.
-
Select the appropriate output option in the To panel:
- Screen – Select this option to display the results in the Analytics display area. If the output table contains a large number of records, it is faster and more useful to save the results to a file than to display the results on the screen.
- Print – Select this option to send the results to the default printer.
- Graph – Select this option to create a graph of the results and display it in the Analytics display area.
- File – Select this option to save or append the results to an Analytics table. The table is added to the open project if it is not already in the project.
Note
Output options that do not apply to a particular analytical operation are disabled.
-
If you selected File as the output type, specify the following information in the As panel:
- File Type – Analytics Table is the only option. Saves the results to a new Analytics table, or appends the results to an existing Analytics table.
- Name – Enter a table name in the Name text box. Or click Name and enter the table name, or select an existing table in the Save or Save File As dialog box to overwrite or append to the table. If Analytics prefills a table name, you can accept the prefilled name, or change it.
You can also specify an absolute or relative file path, or navigate to a different folder, to save or append the table in a location other than the project location. For example: C:\Results\Output.fil or Results\Output.fil.
- Local – Only enabled when connected to a server table. Select Local to save the output table to the same location as the project, or to specify a path or navigate to a different local folder. Leave Local deselected to save the output table to the Prefix folder on a server.
Note
For output results produced from analysis or processing of AX Server tables, select Local. You cannot deselect the Local setting to import results tables to AX Server.
-
Depending on the output type, you can optionally specify a Header and/or a Footer in the text box(es).
Headers and footers are centered by default. Type a left angle bracket (<) before the header or footer text to left align the text. Click Header or Footer to enter a header or footer of more than one line. Alternatively, you can enter a semi-colon (;) as a line-break character in the header or footer text box. Left aligning multiple lines requires a left angle bracket at the beginning of each line.
- Click the More tab.
-
Select the appropriate option in the Scope panel:
- All – This option is selected by default. Leave it selected to specify that all records in the view are processed.
- First – Select this option and enter a number in the text box to start processing at the first record in the view and include only the specified number of records.
- Next – Select this option and enter a number in the text box to start processing at the currently selected record in the view and include only the specified number of records. The actual record number in the leftmost column must be selected, not data in the row.
- While – Select this option to use a WHILE statement to limit the processing of records in the view based on a particular criterion or set of criteria. You can enter a condition in the While text box, or click While to create a WHILE statement using the Expression Builder.
A WHILE statement allows records in the view to be processed only while the specified condition evaluates to true. As soon as the condition evaluates to false, the processing terminates, and no further records are considered. You can use the While option in conjunction with the All, First, or Next options. Record processing stops as soon as one limit is reached.
Note
The number of records specified in the First or Next options references either the physical or the indexed order of records in a table, and disregards any filtering or quick sorting applied to the view. However, results of analytical operations respect any filtering.
If a view is quick sorted, Next behaves like First.
- If you want to break down the output results based on
the values in a character field, enter the field name in the Break text
box, or click Break to select the field,
or to create an expression.
For example, the results of classifying an accounts receivable table by transaction type could be further broken down by customer. Break can only be used with a single character field, so nested breakdowns are not supported.
Note
For the Break option to yield meaningful results, the character field used for the breakdown must be sorted prior to classifying.
- If you selected File (Analytics Table) as the output type, select or deselect Use Output Table depending on whether or not you want the Analytics table containing the output results to open automatically upon completion of the operation.
- If you selected File as the output
type, and want to append the output results to the end of an existing Analytics table,
do one of the following:
Select Append To Existing File if you are certain the output results and the existing table are identical in structure.
Leave Append To Existing File deselected if you want Analytics to compare the record lengths of the output results and the existing table. If the record lengths are not identical, the data structure is not identical, and the append will not work correctly.
Note
Leaving Append To Existing File deselected is recommended if you are uncertain whether the output results and the existing table have an identical data structure. For more information about appending and data structure, see Appending results to Analytics tables and text files.
- Click OK.
- If the overwrite prompt appears, select the appropriate
option.
If you are expecting the Append option to appear and it does not, click No to cancel the operation and see Appending results to Analytics tables and text files.