Classical variables sampling
Classical variables sampling is a statistical sampling method for estimating:
- the total audited value of an account or class of transactions
- the total amount of monetary misstatement in an account or class of transactions
Classical variables sampling works best with financial data that has the following characteristics:
|
a moderate to larger number of misstatements For example, 5% or more of the items are misstated. |
| either overstatements or understatements may exist |
| zero dollar items may exist |
Tip
For a hands-on introduction to the end-to-end process of classical variables sampling in Analytics, see Classical variables sampling tutorial.
Note
In addition to financial data, you can use classical variables sampling with any numeric data that has a variable characteristic – for example, quantity, units of time, or other units of measurement.
How it works
Classical variables sampling allows you to select and analyze a small subset of the records in an account. Based on the results of analyzing the subset, you can estimate the total audited value of the account, and the total amount of monetary misstatement.
The two estimates are computed as ranges:
- The point estimate is the midpoint of a range.
- The upper limit and the lower limit are the two end points of a range.
You can also choose to compute a one-sided estimate or range, with a point estimate and only an upper limit, or only a lower limit.
You compare the estimated range to the book value of the account, or to the misstatement amount that you judge is material, and make a determination regarding the account.
Classical variables sampling supports making this sort of statement:
- There is a 95% probability that the true audited value of the account is between 45,577,123.95 and 46,929,384.17, a range that contains the account book value of 46,400,198.71. Therefore the amounts in the account are fairly stated.
- There is a 95% probability that the misstatement in the account balance is between – 813,074.76 and 539,185.46, which does not exceed the monetary precision of ±928,003.97. Therefore the amounts in the account are fairly stated.
Overview of the classical variables sampling process
Caution
Do not skip calculating a valid sample size.
If you go straight to drawing a sample of records, and guess at a sample size, there is a high likelihood that the projection of your analysis results will be invalid, and your final conclusion flawed.
The classical variables sampling process involves the following stages:
- Prepare (plan) the classical variables sample
- Draw the sample of records
- Perform your intended audit procedures on the sampled data.
- Evaluate the following:
- whether the audited value of the sampled data, when projected to the account as a whole, falls within an acceptable range of the recorded book value
- whether the observed levels of monetary misstatement in the sampled data represent an acceptable or unacceptable amount of misstatement in the account as a whole
Values are retained and prefilled between stages
Classical variables sampling in Analytics requires that you enter information in three separate dialog boxes, and run the associated commands, in this order:
- CVS Prepare dialog box
- CVS Sample dialog box
- CVS Evaluate dialog box
As you move through this process, information from one dialog box is automatically prefilled into the next dialog box. Prefilling saves considerable labor, and removes the risk of accidentally entering incorrect values and invalidating the sample.
However, values that automatically prefill the CVS Sample and the CVS Evaluate dialog boxes are only stored temporarily, and are deleted when you close the Analytics project.
Regenerating classical variables sampling values
In a production environment, you typically perform the different stages of the classical variables sampling process at different times. You can use any of the following methods for regenerating the classical variables sampling values that are lost when you close Analytics.
The first method is the easiest.
- Save the prefilled commands
The results of the CVS Prepare and the CVS Sample stages include subsequent commands in the classical variables sampling process that are prefilled with the required values. Save these prefilled commands in separate scripts to use later.
For more information, see Classical variables sampling tutorial.
- Save the executed commands in scripts
After performing the CVS Prepare and CVS Sample stages, copy the CVSPREPARE and CVSSAMPLE commands from the Analytics display area and save them in separate scripts. You can run these scripts later to regenerate the classical variables sampling values.
The drawback of this method is that you draw a redundant sample of records.
- Retrieve the executed commands from the log
Copy the CVSPREPARE and CVSSAMPLE commands from the log, and re-run them in the command line to regenerate the classical variables sampling values.
The drawback of this method is that locating the correct instances of the commands in the log can be difficult, and you draw a redundant sample of records.
Changing prefilled values
Normally you should not change any of the prefilled classical variables sampling values. Changing prefilled values can negate the statistical validity of the sampling process.
Caution
Update prefilled values only if you have the statistical knowledge to understand the effect of the change.
Numeric length limitation
Several internal calculations occur during the preparation stage of classical variables sampling. These calculations support numbers with a maximum length of 17 digits. If the result of any calculation exceeds 17 digits, the result is not included in the output, and you cannot continue with the sampling process.
Note that source data numbers of less than 17 digits can produce internal calculation results that exceed 17 digits.
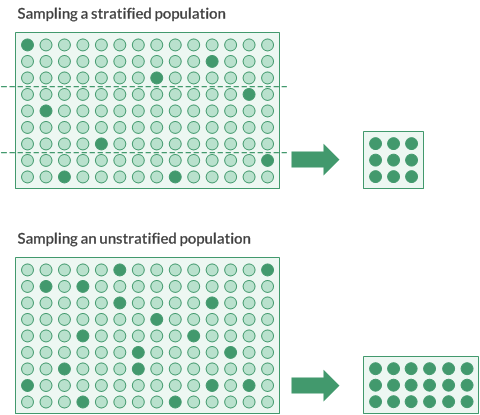
Stratification
Classical variables sampling gives you the option of numerically stratifying the records in a population before drawing a sample.
The benefit of stratification is that it often dramatically reduces the required sample size while still maintaining statistical validity. A reduced sample size means less data analysis work is required to reach your goal.
How it works
Stratification works by dividing a population into a number of subgroups, or levels, called strata. Ideally, the values in each stratum are relatively homogenous.
A statistical algorithm (the Neyman method) sets the boundaries between the strata. The algorithm positions the boundaries to minimize the dispersion of values within each stratum, which decreases the effect of population variance. Reducing the variance, or 'spread', reduces the required sample size. By design, the range of each stratum is not uniform.
The required number of samples is then calculated on a per-stratum basis, and totaled, rather than on the basis of the entire, unstratified population. For the same set of data, the stratified approach typically results in a much smaller sample size than the unstratified approach.
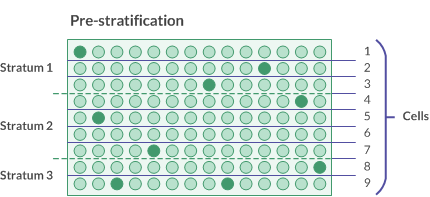
Pre-stratification using cells
As part of the stratification process, you specify the number of cells to use to pre-stratify the population. Cells are uniform numeric divisions, and narrower than strata.
A statistical algorithm uses the count of the records in each cell as part of the calculation that assigns optimal strata boundaries. Cells are not retained in the final stratified output.
At a minimum, the number of specified cells must be twice the number of specified strata.
Note
Pre-stratification cells and the cells used in the cell method of sample selection are not the same thing.
Too much of a good thing
Stratification is a powerful tool for managing sample size, but you should exercise care when specifying the number of strata and the number of cells.
As a starting point, try:
- 4 to 5 strata
- 50 cells
After a certain point, increasing the number of strata, or the number of cells, has little or no effect on sample size. However, these increases can adversely affect the design of the sample, or the performance of Analytics when stratifying large data sets.
Regarding sample design, when you reach the evaluation stage you need to have a minimum number of misstatements in each stratum in order to reliably project misstatements to the entire population. If you have too many strata in relation to the number of misstatements, problems can occur with the projection.
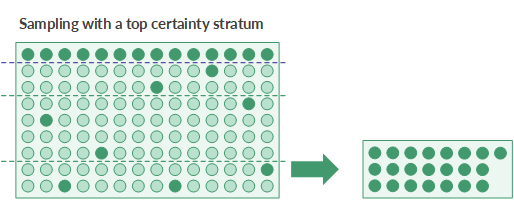
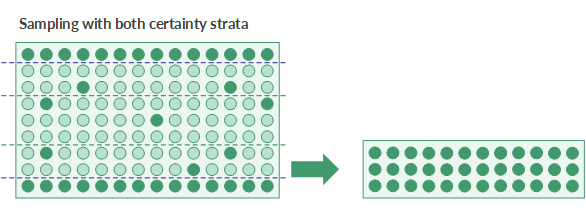
The certainty strata
Defining a certainty stratum is another available stratification option. You can define a top certainty stratum, a bottom certainty stratum, or both.
Using a certainty stratum has two benefits:
- Automatic inclusion Individually significant items, or high value items, are automatically included in the sample, and not at risk of being excluded by the random selection method.
- Reduction of variance Certainty stratum items are removed from the sample size calculation. Because of their nature, high value items can significantly increase population variance, and the required sample size, if they are included in the calculation.
Defining a certainty stratum
To define a certainty stratum, you specify a numeric cutoff value:
- Top certainty stratum cutoff All key-field book values greater than or equal to the cutoff value are automatically selected and included in the sample.
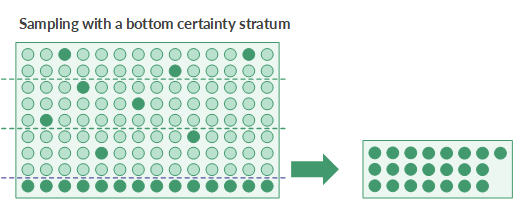
- Bottom certainty stratum cutoff All key-field book values less than or equal to the cutoff value are automatically selected and included in the sample.
Using a bottom certainty stratum is useful if large negative values are present in a population and you want to automatically include them.
The portion of the population not captured by a certainty stratum is sampled using the random selection method.
Note
Depending on the nature of the data, the overall sample size may increase as you lower the cutoff value for the top certainty stratum, or raise the cutoff value for the bottom certainty stratum.
You should avoid setting a cutoff value too generously. Consult a sampling specialist if you are unsure where to set a cutoff value.
Coordinating top and bottom certainty strata
If you decide to use both a top and a bottom certainty stratum when drawing a sample you need to consider how the top and bottom cutoff values relate:
- Certainty strata cannot overlap An error occurs if you specify a top cutoff value that is less than a bottom cutoff value.
- Leave sufficient room between the cutoff values If you specify cutoff values that are too close to each other, most of the population is automatically included in the sample, which defeats the purpose of sampling.
How classical variables sampling selects records
Classical variables sampling uses the following process for selecting sample records from an Analytics table:
- You specify a numeric field as the basis for the sampling. The sampling unit is an individual record in the table.
- Using the random selection method, Analytics selects samples from among the records in the table.
- If you are using stratification, a roughly equal number of records are randomly selected from each stratum.
- If you are not using stratification, records are randomly selected from the entire population.
- The selected records are included in the sampling output table.
Example
In a table with 300 records, divided into 3 strata, Analytics could select the following record numbers:
| Stratum 1 | Stratum 2 | Stratum 3 |
|---|---|---|
|
|
|
In an unstratified table with 300 records Analytics could select the record numbers displayed below. You can see that the selected record numbers are less evenly distributed.
Note
The record numbers below are grouped in three columns for ease of comparison, but the columns do not represent strata.
|
|
|
Unbiased sample selection
Classical variables sampling is unbiased and it is not based on the amounts contained in a record. Each record has an equal chance of being selected for inclusion in the sample. A record containing a $1000 amount, a record containing a $250 amount, and a record containing a $1 amount all have the same chance of being selected.
In other words, the probability that any given record will be selected has no relation to the size of the amount it contains.
If you want to ensure that records containing the largest amounts are selected, see The certainty strata.