This tutorial introduces you to the end-to-end process of classical variables sampling in Analytics.
Estimated time 30 minutes
Summary You will draw a sample of records from an invoices table, and identify misstatements in the sample. Based on the sample results, you will make a statistical estimate of two amounts:
- the total audited value of the entire table
- the total amount of misstatement in the entire table
You then use the statistical estimate to judge whether the invoice records as a whole are fairly stated.
Main tasks To perform classical variables sampling correctly, you need to do four main tasks:

The tutorial leaves out some optional aspects of classical variables sampling, and focuses on a single path, so you can quickly get a basic understanding of how classical variables sampling in Analytics works.
Tip
For simple definitions of sampling terms, see A word about terminology.
Classical variables sampling scenario
Detecting misstatement in accounts receivable
The scenario
You are examining an Invoices table with over 4000 records as part of confirming accounts receivable. You want to contact a sample of invoiced customers to confirm outstanding amounts in the account, and detect any misstatement.
You will use the customer contacts to confirm:
- receivable amounts exist
- receivable amounts are correctly recorded
How do you proceed?
How many customers should you contact? How do you decide which ones to contact? How do any misstatements you find in the sample relate to the entire account?
You can use Analytics classical variables sampling to get answers to these questions.
Analytics table used in the scenario
This scenario uses the Invoices table in the ACL_Rockwood.acl sample data file included with Analytics.
Note
Most of the amounts in the Invoices table in ACL_Rockwood.acl have a status of "Paid". For this scenario, assume they have a status of "Outstanding" and a payment amount of $0.00.
Note
Do not include the thousands separator, or the percentage sign, when you specify values. These characters prevent the command from running, or cause errors.
1 Stratify the population, and calculate a valid sample size
Note
In a production environment, the values you specify to stratify a population, and calculate a valid sample size, are dependent on your professional judgment.
- In ACL_Rockwood.acl, open the Invoices table, located in the Sales_and_collection folder.
- Select Sampling > Classical Variables Sampling (CVS) > Prepare.
- Specify the input values exactly as they appear in the screen below and click OK.
Make sure the invoice_amount field is selected in the Book Value drop-down list.
Analytics stratifies the population and calculates the sample size for each stratum, and for the population as a whole.
- Optional. Pin the tab with the output results of the stratification and sample size calculation.
If you pin the output results as you proceed through the classical variables sampling process, you can review the entire process once you have completed it.
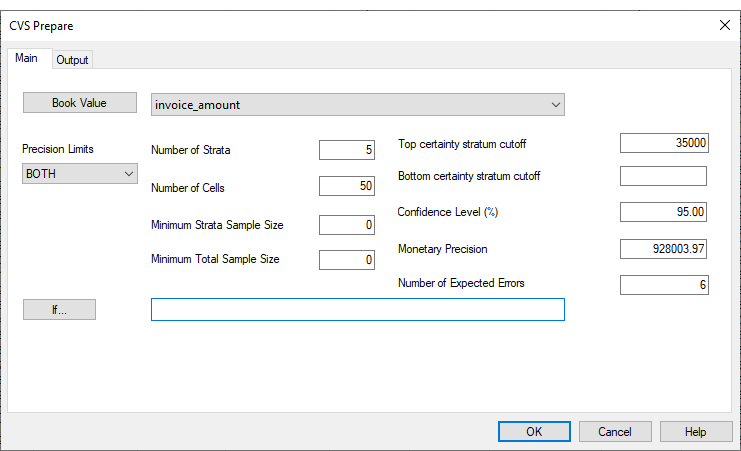
What the input values mean
| Book Value | The invoice_amount field contains the book values you are auditing. |
|---|---|
| Precision Limits |
You leave Both selected (the default setting) because:
|
| Number of Strata |
You want to divide the population into 5 strata, or subgroups, as a way of significantly reducing the sample size. |
| Number of Cells |
You specify 50 cells to use for pre-stratifying the population. Cells are narrower numeric divisions than strata. Pre-stratification is part of an internal process that optimizes the position of strata boundaries. Cells are not retained in the final stratified output. The number of cells must be at least twice (2 x) the number of strata. |
| Minimum Strata Sample Size |
Optional. Leaving the default value of zero (0) means that you are not enforcing a minimum number of sampled records in each stratum. |
| Minimum Total Sample Size |
Optional. Leaving the default value of zero (0) means that you are not enforcing a minimum total sample size. |
| Top certainty stratum cutoff |
You want to sample and test 100% of the book value items greater than or equal to $35,000. Every item in the top certainty stratum will be included in the sample output table. |
| Bottom certainty stratum cutoff |
Optional. Leaving the field empty means that you are not specifying a bottom certainty stratum. |
| Confidence Level (%) |
You want a 95% degree of confidence that the sample you are going to draw is representative of the entire population. Put another way: if you drew the sample 100 times, it would be representative 95 times, and unrepresentative only 5 times. |
| Monetary Precision |
Monetary precision is tolerable misstatement minus expected misstatement. You are willing to tolerate total misstatement of up to 3% of the account book value, and you expect the misstatement to be 1% of the account book value, so you are left with a monetary precision of 2%, or $928,003.97. |
| Number of Expected Errors | You expect the count of misstatement errors in the sample to be at least 6. |
What the results mean
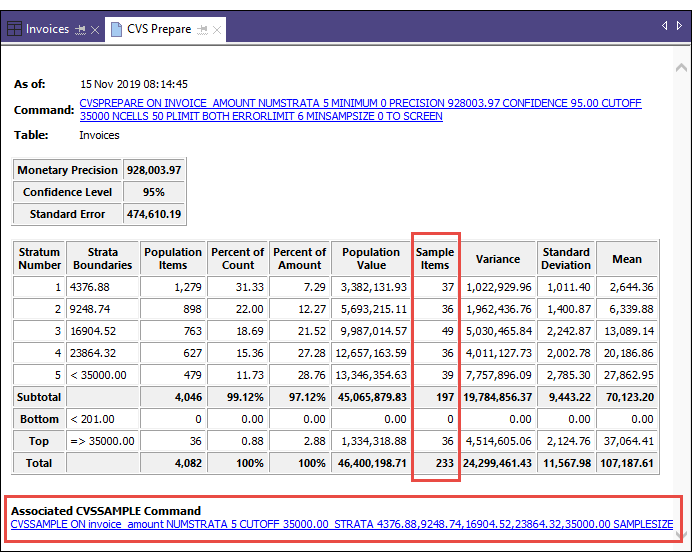
| Sample Items |
You should contact 233 customers in total. For each population stratum, and for the top certainty stratum, you should contact the specified number of customers. For example, for Stratum 3, you should contact 49 customers. |
|---|---|
| Strata Breakdown |
The stratification of the population constructed by Analytics. Several descriptive values are provided for each stratum, and for the top certainty stratum, including:
|
| Descriptive Statistics |
Several descriptive statistics provide insight into the statistical properties of the population strata:
|
| Associated CVSSAMPLE Command |
The CVS Prepare results provide a prefilled version of the command that is used at the CVS Sample stage of the classical variables sampling process (the next stage). The values used to prefill the command are not saved when you close Analytics. You can manually save the prefilled command to preserve the values and avoid the work of regenerating them later. In a production environment, you may run through the CVS Prepare stage multiple times as you optimize stratification of the population and sample size. With each iteration of CVS Prepare you can manually save the associated CVSSAMPLE command. |
Save the CVSSAMPLE command (optional)
Note
For the purposes of the tutorial, saving the command is not required, as long as you do not close Analytics. In a production environment, saving the command is a good idea.
Save the CVSSAMPLE command in case you need to recover the values it contains.
- At the bottom of the CVS Prepare display area, click the CVSSAMPLE link to load the command into the command line.
- Copy the entire command from the command line and save it in an Analytics script with the name CVS_Sample.
2 Draw the sample of records
- Return to the Invoices table.
- Select Sampling > Classical Variables Sampling (CVS) > Sample.
- Specify the input values exactly as they appear in the screen below and click OK to draw the sample of records.
Note
Most of the values are prefilled from the output results of the CVS Prepare stage.
If a number of the prefilled values are missing, see Use the CVSSAMPLE command (optional).
Make sure you specify the Seed value exactly as shown below: 12345
The seed value is used to initialize the random selection of records for the sample. If you use a different seed value, a different group of records is selected, and none of the sample amounts will match in the examples that follow.
- Optional. Pin the tab with the summary results of the sampling process.
If you pin the output results as you proceed through the classical variables sampling process, you can review the entire process once you have completed it.

Use the CVSSAMPLE command (optional)
Note
You can skip this section if you have kept Analytics open throughout the tutorial.
If a number of the prefilled values are missing from the CVS Sample dialog box, you may have closed Analytics between the CVS Prepare and CVS Sample stages and lost the values.
Instead of using the CVS Sample dialog box to draw the sample of records, you can use the CVSSAMPLE command you saved in a script.
- Open the CVS_Sample script and make these updates to the CVSSAMPLE command:
NUMSTRATA 5 SEED 12345 CUTOFF 35000.00
TO Invoices_sample
- Make sure the Invoices table is open.
- Run the script, or copy the entire command to the command line and press Enter.
If you run the script, double-click the CVSSAMPLE command in the log to open the CVS Sample display area.
Tip
If you didn't save the CVSSAMPLE command, you can perform the CVS Prepare stage again to regenerate the values required by the CVS Sample stage. You can open the Invoices table and quickly rerun the CVSPREPARE command from the log.
What the input values mean
|
Book Value Number of Strata Top certainty stratum cutoff Strata Boundaries Sample Size Population (count, value) |
The input values are prefilled based on values that you provided, or that Analytics calculated, during the CVS Prepare stage. |
|---|---|
| Seed |
Optional. Specifying a seed value is optional, but to ensure that the records included in the sample match the tutorial sample you need to specify an identical seed value. |
| To |
The sample of records drawn from the Invoices table is output to a new table called Invoices_sample. |
What the results mean

|
Seed Book Value Field |
The input values you provided. |
|---|---|
| Selection Method |
Analytics used the Random selection method to draw the specified number of records from each stratum. All records in the top certainty stratum are automatically selected. |
| Strata Breakdown |
The same breakdown that appears in the output of the CVS Prepare stage. Now that actual sample records have been drawn, Analytics can calculate the Sample Value for each stratum in the sample, and for the sample as a whole. Note the difference between the Sample Value and the Population Value. |
| Associated CVSEVALUATE Command |
The CVS Sample results provide a prefilled version of the command that is used at the CVS Evaluate stage of the classical variables sampling process (the final stage). The values used to prefill the command are not saved when you close Analytics. You can manually save the prefilled command to preserve the values and avoid the work of regenerating them later. In a production environment, several weeks could elapse between the CVS Sample and the CVS Evaluate stages during which you are performing audit procedures on the sample data. |
Save the CVSEVALUATE command (optional)
Note
For the purposes of the tutorial, saving the command is not required, as long as you do not close Analytics. In a production environment, saving the command is a good idea.
Save the CVSEVALUATE command in case you need to recover the values it contains.
- At the bottom of the CVS Sample display area, click the CVSEVALUATE link to load the command into the command line.
- Copy the entire command from the command line and save it in an Analytics script with the name CVS_Evaluate.
Add the Audit_Value field and export the sample table
Because Analytics is a read-only application, you need to export the table of sampled records to Excel so that you can add audit values.
Before you export the table, you need to add a field that replicates the Invoice Amount field. In Excel, you edit the replicated field.
Add the Audit_Value field
- Close the Invoices table.
- Open the Invoices_sample table.
- Copy and paste this command into the command line:
DEFINE FIELD AUDIT_VALUE COMPUTED invoice_amount
If the command line is not visible, select Window > Command Line.
- Press Enter to create the new field.
Tip
If you want to confirm that the AUDIT_VALUE field was created, type display in the command line and press Enter to see a list of the fields in the table.
Export the sample table to Excel
- Select Data > Export.
- On the Main tab, make sure Fields is selected.
- Click Export Fields > Add All.
- Select each of these fields and use the Up arrow
 to move them to the top of the Selected Fields list:
- SAMPLE_RECORD_NUMBER
- STRATUM
- invoice_amount
- AUDIT_VALUE
Keep the order shown here.
- Click OK.
- In the Export As drop-down list, select Excel (*.xlsx).
- In the To field, type Invoices_sample_audited, and click OK.
- Click the Output to link to open the Excel file.
Note
Do not close Analytics.
3 Perform your analysis on the sample
For the purposes of the tutorial, assume that you do the following:
- Contact the customers that appear in the Invoices_sample_audited table.
- Confirm receivable amounts and record any misstatements.
Update the Excel file
- Update the Excel file with the values listed in the AUDIT_VALUE field in the table below.
- Save and close the Excel file.
You are specifying:
- three misstatements per stratum
- one misstatement in the top certainty stratum
- both overstatements and understatements
Note
To make it easier to update the Excel file, and to demonstrate how the subsequent evaluation works:
- the updates are all in the first few records in the file
- understatements, and a mix of understatements and overstatements, are each grouped in a particular stratum
In a production environment, the likelihood is that overstatements and understatements would be scattered across strata, and throughout the file.
Tip
Copy and paste the entire table below to an blank Excel worksheet, and then copy the audit values to the AUDIT_VALUE column in the Invoices_sample worksheet.
As an alternative, you can download a text file with a column of the audit values.
| SAMPLE_RECORD_NUMBER | STRATUM | Invoice Amount | AUDIT_VALUE |
|---|---|---|---|
|
1 |
3 | 9,394.55 | 9,494.55 |
| 2 | 5 | 27,033.66 | 17,033.66 |
| 3 | 4 | 22,617.90 | 22,917.90 |
| 4 | 2 | 4,576.24 | 4,575.83 |
| 5 | 1 | 4,039.67 | 0.00 |
| 6 | 3 | 13,753.12 | 31,753.12 |
| 7 | 4 | 23,633.12 | 23,433.12 |
| 8 | 5 | 33,663.50 | 33,660.00 |
| 9 | 2 | 7,136.79 | 6,136.79 |
| 10 | 2 | 4,495.13 | 0.00 |
| 11 | 1 | 1,575.87 | 1,075.87 |
| 12 | 0 | 44,379.67 | 34,379.67 |
| 13 (audit value unchanged) | 0 | 35,159.99 | 35,159.99 |
| 14 | 5 | 27,204.08 | 27,200.00 |
| 15 | 4 | 20,156.50 | 20,000.00 |
| 16 (audit value unchanged) | 0 | 37,448.07 | 37,448.07 |
| 17 | 3 | 11,879.05 | 11,889.05 |
| 18 | 1 | 994.98 | 964.98 |
4 Project the analysis results to the entire population
Import the updated sample table
Note
Make sure the Excel file with the audit values that you updated is closed.
- In Analytics, select Import > File.
- In the Select File to Define dialog box, locate and select ..\Sample Data Files\ACL_Rockwood\Invoices_sample_audited.xlsx and click Open.
- In the File Format page, verify that Excel file is selected and click Next.
- In the Data Source page, select the Invoices_sample worksheet.
- Make sure these options are set as indicated and click Next:
- Use first row as Field Names is selected
- Start On Line is 1
- Import all fields as character type is not selected
- In the Excel Import page, verify that the invoice_amount field and the AUDIT_VALUE field have a Type of Numeric, and click Next.
Select the field headers to check their assigned Type. If necessary, update the Type to Numeric, and specify 2 in the Decimal field.
- In the Save Data File As dialog box, type Invoices_sample_audited in the File name field, and click Save.
- In the Final page, click Finish.
- In the dialog box for specifying a table layout name, click OK.
A new Analytics table is created with the data from the imported Excel file.
Evaluate the results of the sample analysis
- Open the Invoices_sample_audited table if it is not already open.
- Select Sampling > Classical Variables Sampling (CVS) > Evaluate.
Note
The menu option is disabled if a table is not open.
- Specify the input values exactly as they appear in the screen below and click OK to project the sample results to the entire population.
Note
Most of the values are prefilled from the output results of the CVS Prepare and CVS Sample stages.
If a number of the prefilled values are missing, see Use the CVSEVALUATE command (optional).
- Optional. Pin the tab with the evaluation results.
If you pin the output results as you proceed through the classical variables sampling process, you can review the entire process once you have completed it.

Use the CVSEVALUATE command (optional)
Note
You can skip this section if you have kept Analytics open throughout the tutorial.
If a number of the prefilled values are missing from the CVS Evaluate dialog box, you may have closed Analytics between the CVS Sample and the CVS Evaluate stages and lost the values.
Instead of using the CVS Evaluate dialog box to evaluate results, you can use the CVSEVALUATE command you saved in a script.
- Open the CVS_Evaluate script and make these updates to the CVSEVALUATE command:
AUDITED AUDIT_VALUE ETYPE DIFFERENCE
- Make sure the Invoices_sample_audited table is open.
- Run the script, or copy the entire command to the command line and press Enter.
If you run the script, double-click the CVSEVALUATE command in the log to open the evaluation results.
Tip
If you didn't save the CVSEVALUATE command, you can perform the CVS Prepare and CVS Sample stages again to regenerate the values required by the CVS Evaluate stage. You can open the Invoices table and quickly rerun the CVSPREPARE and CVSSAMPLE commands from the log.
What the input values mean
| Estimation Type |
You are specifying the Difference estimation type. Classical variables sampling in Analytics has four different ways of estimating the results of sample analysis when projected to the entire population. |
|---|---|
|
Audit Value |
The AUDIT_VALUE field contains the audit values. |
|
Confidence Level (%) Number of Expected Errors Book Value Precision Limits Strata Boundaries Population (Count, Value) Top certainty stratum cutoff (Cutoff, Count, Value) |
The input values are prefilled based on values that you provided, or that Analytics calculated, during the CVS Prepare stage. |
What the projected results mean

|
Point Estimate Precision |
Point Estimate (46,253,254.06) a statistical projection of the most likely audited value of the entire Invoices table Precision (676,130.11) a statistical projection of the amount by which the Point Estimate could vary
|
|---|---|
| Estimated Total Audited Value |
A visual presentation of the Estimated Total Audited Value range. How the range works
|
| Estimated Total Error |
A visual presentation of the Estimated Total Error range. How the Error range is calculated
How the range works
|
Judging whether the invoice records as a whole are fairly stated
You have two ways of judging whether the invoice records as a whole are fairly stated. You can look at the estimated total audited value, or you can look at the estimated total error.
Estimated Total Audited Value
The Population Book Value of 46,400,198.71 falls within the Estimated Total Audited Value range, so the account as a whole is very likely to be fairly stated.

The evaluation results support making this sort of statement:
There is a 95% probability that the true audited value of the account is between 45,577,123.95 and 46,929,384.17, a range that contains the account book value of 46,400,198.71. Therefore the amounts in the account are fairly stated.
Estimated Total Error
The Estimated Total Error range falls within the Monetary Precision range, so the account as a whole is very likely to be fairly stated.

The evaluation results support making this sort of statement:
There is a 95% probability that the misstatement in the account balance is between – 813,074.76 and 539,185.46, which does not exceed the monetary precision of ±928,003.97. Therefore the amounts in the account are fairly stated.