This tutorial introduces you to the end-to-end process of monetary unit sampling in Analytics.
Estimated time 20 minutes
Summary You will draw a sample of records from an invoices table, and identify misstatements in the sample. Based on the sample results, you will make a statistical estimate of the total amount of misstatement in the entire table.
You then use the statistical estimate to judge whether the invoice records as a whole are fairly stated.
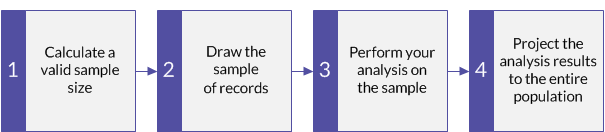
Main tasks To perform monetary unit sampling correctly, you need to do four main tasks:
The tutorial leaves out optional aspects of monetary unit sampling, and focuses on a single path, so you can quickly get a basic understanding of how monetary unit sampling in Analytics works.
Tip
For simple definitions of sampling terms, see A word about terminology.
Monetary unit sampling scenario
Detecting misstatement in accounts receivable
The scenario
You are examining an Invoices table with over 4000 records as part of confirming accounts receivable. You want to contact a sample of invoiced customers to confirm outstanding amounts in the account, and detect any misstatement.
You will use the customer contacts to confirm:
- receivable amounts exist
- receivable amounts are correctly recorded
How do you proceed?
How many customers should you contact? How do you decide which ones to contact? How do any misstatements you find in the sample relate to the entire account?
You can use Analytics monetary unit sampling to get answers to these questions.
Analytics table used in the scenario
This scenario uses the Invoices table in the ACL_Rockwood.acl sample data file included with Analytics.
Note
Most of the amounts in the Invoices table in ACL_Rockwood.acl have a status of "Paid". For this scenario, assume they have a status of "Outstanding" and a payment amount of $0.00.
Note
Do not include the thousands separator, or the percentage sign, when you specify values. These characters prevent the command from running, or cause errors.
1 Calculate a valid sample size
Note
In a production environment, the values you specify to calculate a valid sample size are dependent on your professional judgment.
- In ACL_Rockwood.acl, open the Invoices table, located in the Sales_and_collection folder.
- Click the Invoice Amount header to select the column.
- Select Analyze > Profile to calculate the absolute value of the Invoice Amount field. Pin the Profile tab with the results of the calculation.
- Select Sampling > Record/Monetary Unit Sampling > Calculate Size.
- Leave Monetary selected.
- Specify the input values exactly as they appear in the screen below and click Calculate to calculate the sample size.
After reviewing the results, you can click OK to finalize the sample size calculation, or you can experiment with specifying different values (see below).

What the input values mean
| Confidence |
You want a 95% degree of confidence that the sample you are going to draw is representative of the entire population. Put another way: if you drew the sample 100 times, it would be representative 95 times, and unrepresentative only 5 times. |
|---|---|
| Population |
The absolute value of the Invoice Amount field in the Invoices table. |
| Materiality |
The total amount of misstatement in the account must exceed $1,392,005.96 (3%) to be considered a material misstatement. |
| Expected Total Errors | You expect the total amount of misstatement in the account is $464,001.99 (1%). |
What the results mean
| Sample Size | You should contact 219 customers. |
|---|---|
| Interval |
If you use one of the interval methods of sample selection, the records selected correspond to either:
Note In Analytics, 1 monetary unit = 1 cent For a detailed explanation, see How monetary unit sampling selects records. |
| Maximum Tolerable Taintings (%) |
Note The monetary unit sampling tutorial does not use this number, which provides an alternative method for evaluating misstatement. What the number means:
In a misstated amount, tainting is the percentage of the book value that the misstatement represents. For a detailed explanation, see Maximum Tolerable Taintings (%). |
Learn more: experiment by specifying different values
Change a value in any of the following fields in the Size dialog box, click Calculate, and notice how the results change. Change only one value at a time so it is easier to see how the change affects the results.
- Confidence
- Materiality
- Expected Total Errors
More stringent requirements increase the sample size. More lenient requirements decrease the sample size.
Reset the values to match the screen above and click OK. Pin the Size tab with the results of the sample size calculation.
2 Draw the sample of records
- Return to the Invoices table.
If the Invoice Amount column is still selected, click the top left corner of the table view to deselect it. (The blank area to the left of the first column header.)
- Select Sampling > Record/Monetary Unit Sampling > Sample.
- Leave MUS selected.
- Specify the input values exactly as they appear in the screen below and click OK to draw the sample of records.
Make sure the invoice_amount field is selected in the Sample On drop-down list.

What the input values mean
| Sample On | The invoice_amount field contains the book values you are auditing. |
|---|---|
| Fixed Interval |
You are using the fixed interval selection method for drawing the sample of records. With the fixed interval selection method, you specify the initial monetary unit that is selected, and all subsequent selections are a fixed interval or distance apart. For a detailed explanation, see Fixed interval selection method. |
| Interval |
The interval between selected monetary units is $211,409.18, or 21,140,918 units. |
| Start |
The initial monetary unit selected is $0.01, or unit 1. |
| To |
The sample of records drawn from the Invoices table is output to a new table called Invoices_sample. |
3 Perform your analysis on the sample
For the purposes of the tutorial, assume that you do the following:
- Contact the customers that appear in the Invoices_sample table.
- Confirm receivable amounts and record any misstatements.
4 Project the analysis results to the entire population
- Select Sampling > Record/Monetary Unit Sampling > Evaluate.
Note
The menu option is disabled if a table is not open.
- Leave Monetary selected.
- Specify the input values exactly as they appear in the screen below and click OK to project the results.
Note
Use a comma between Item amount and Error, but do not use commas in the amounts. Enter each amount and error on a separate line.

What the input values mean
| Confidence |
The same degree of confidence you specified when you calculated sample size. |
|---|---|
| Interval |
The interval you used when you drew the sample. |
| Errors |
When you confirmed receivable amounts, misstatements entered in the format: book amount,misstatement amount In this example:
|
What the projected results mean
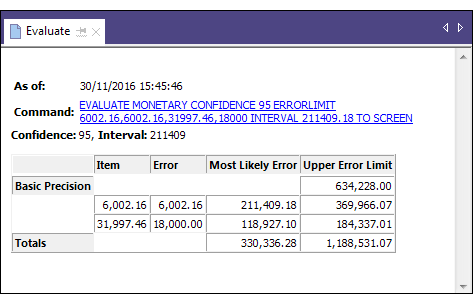
| Basic Precision |
Basic allowance for sampling risk: $634,228.00. Analytics calculates a basic allowance for sampling risk because even if you found no misstatements in the sample, you cannot be sure that no misstatements exist in the account as a whole. |
|---|---|
| Most Likely Error |
Total projected misstatement for the account: $330,336.28. A projection to the entire account of actual misstated amounts you found in the sample. |
|
Upper error limit (Total) |
The maximum amount of misstatement for the entire account, projected with a 95% degree of confidence: $1,188,531.07 Put another way: There is a 95% probability that the total amount of misstatement in the Invoices table does not exceed $1,188,531.07. Because $1,188,531.07 is less than the $1,392,005.96 you specified for Materiality when you calculated the sample size, you can conclude that the accounts receivable are not materially misstated. For a detailed explanation, see What the “Upper Error Limit” tells you. |
Learn more: experiment by specifying different values
Rerun the evaluate command with different values in the Errors field to see how the result changes.
The table below summarizes different results.
|
Misstatements (in the sample) |
Upper error limit (projected maximum) |
Conclusion |
|---|---|---|
|
6,002.16, 6,002.16 31,997.46, 18,000.00 |
1,188,531.07 |
The account is not materially misstated. $1,188,531.07 < the materiality threshold of $1,392,005.96
|
|
6,002.16, 6,002.16 31,997.46, 18,000.00 13,225.50, 8,644.34 |
1,392,005.84 |
In strict terms, the account is not materially misstated. However, $1,392,005.84 is very close to the materiality threshold of $1,392,005.96. Note This example demonstrates the difference between using Upper error limit and Maximum Tolerable Taintings (%) to evaluate misstatement. If you use the more stringent Maximum Tolerable Taintings (%) method, the account is materially misstated. The sum of the tainting percentages in the "Misstatements" column to the left is 221.61% (100% + 56.25% + 65.36%), which is slightly greater than the Maximum Tolerable Taintings (%) of 219.48% reported when you calculated sample size. |
|
6,002.16, 6,002.16 31,997.46, 18,000.00 13,225.50,13,225.50 |
1,505,511.86 |
The account is materially misstated. $1,505,511.86 > the materiality threshold of $1,392,005.96 |