Reading Excel and PDF reports
Evaluations reports feature a broad range of information in a variety of formats. Learn how to view, understand, and use the reports that you've generated.
Reading Excel Reports
-
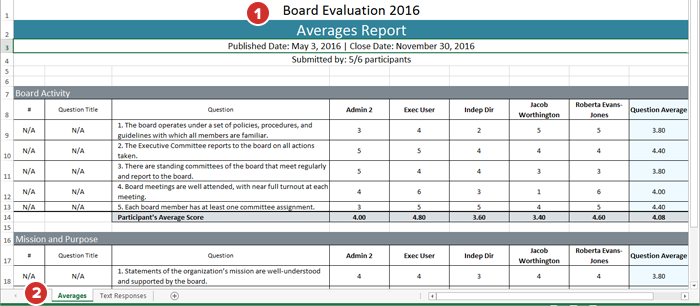
Both types of Excel reports display, in the header, the name of the evaluation, the name of the report, the publish and close dates, and the number of participants who submitted the questionnaire and are included in the report, as well as the overall number of invited participants.
-
The Averages report displays, on the first tab of the spreadsheet:
-
Each participant's responses to single-select (radio button) list questions.
-
Participant average responses for each section. Sections correspond to individual pages from the evaluation, so you are able to group questions by subject or theme in order to view more specific averages for each topic.
Note
Be sure to name each page in your evaluation or questionnaire. Unnamed pages are titled "New Page" on analytics reports.
-
The average response for each single-select question, across all participants who answered that question.
-
The overall average for a section.
Note
For non-numerical or mixed (numerical and non-numerical) list questions, a numerical value is assigned to each possible response for average calculation purposes. In a typical rating list, for example, "Strongly Agree" would be assigned the number 5, "Somewhat Agree" would be assigned 4, and so on.
Note
When calculating the average for a question, only participants who answered a question are counted. Non-responses do not lower the average score for a question.
-
-
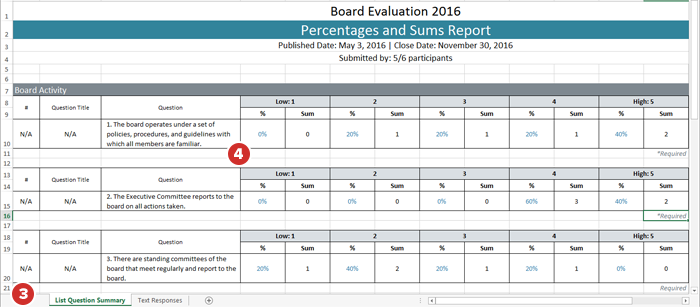
The Percentages and Sums report displays, on the first tab of the spreadsheet:
-
Tabulation of each possible response as a percentage of total responses (for radio button questions).
Note
For checkbox/multi-select questions, the report displays "N/A" under the percentage column.
-
The raw total of participants who chose each response, for both radio button and checkbox questions.
Note
Percentages are calculated as a portion of responses, not the total number of participants on an evaluation. If a participant did not answer a question, they are not counted when the percentage is calculated.
-
-
Both types of report also display question number, title and text, and state whether a question was required.
Note
Questions that aren't numbered and/or titled display "N/A" in those respective fields.
-
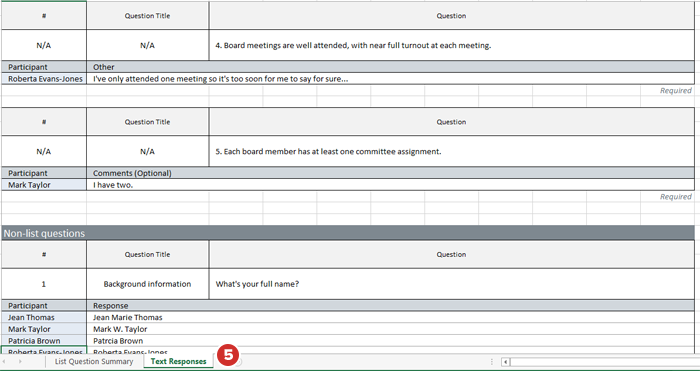
The second tab of the spreadsheet (titled "Text Responses"), for both types of Excel report, displays all non-list questions and answers, along with any additional text responses provided by participants (for instance, optional comments or "Other" responses to list questions).
Reading PDF Reports
-
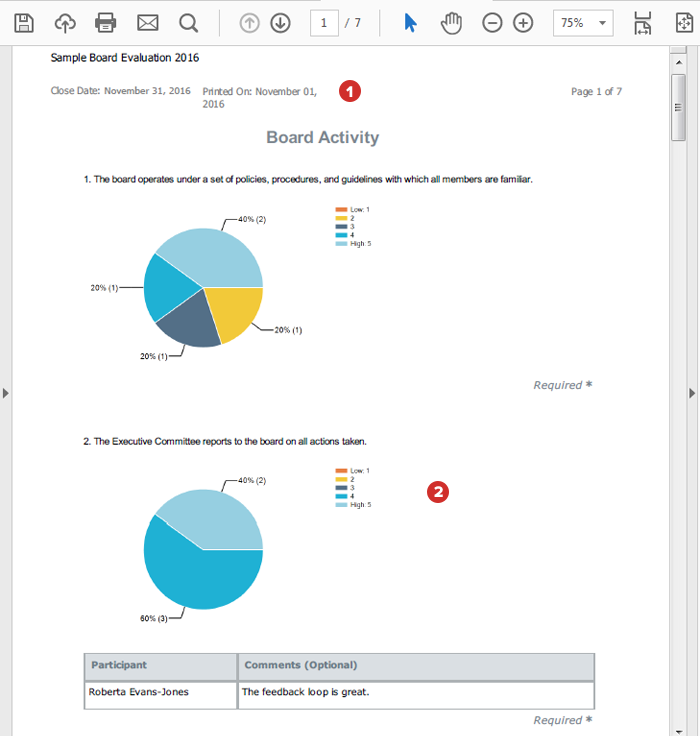
All PDF reports display, in the header, the name of the evaluation or questionnaire, the page number or page range, the close date, and the date of export or printing.
-
The Pie Chart report visually displays single-select responses as a percentage of all responses. Checkbox (multi-select) responses are displayed as bar charts.
-
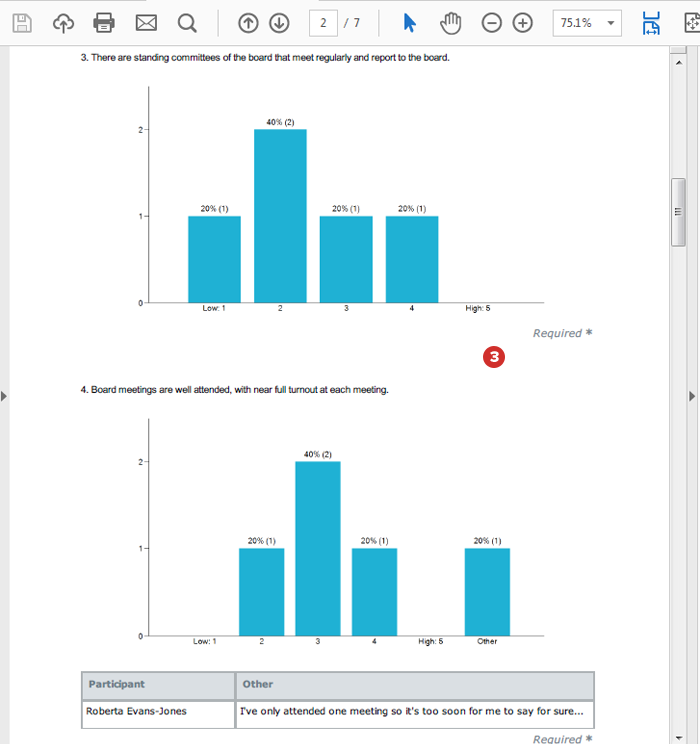
The Bar Chart report allows for easy visual comparison of the number of responses for each question.
-
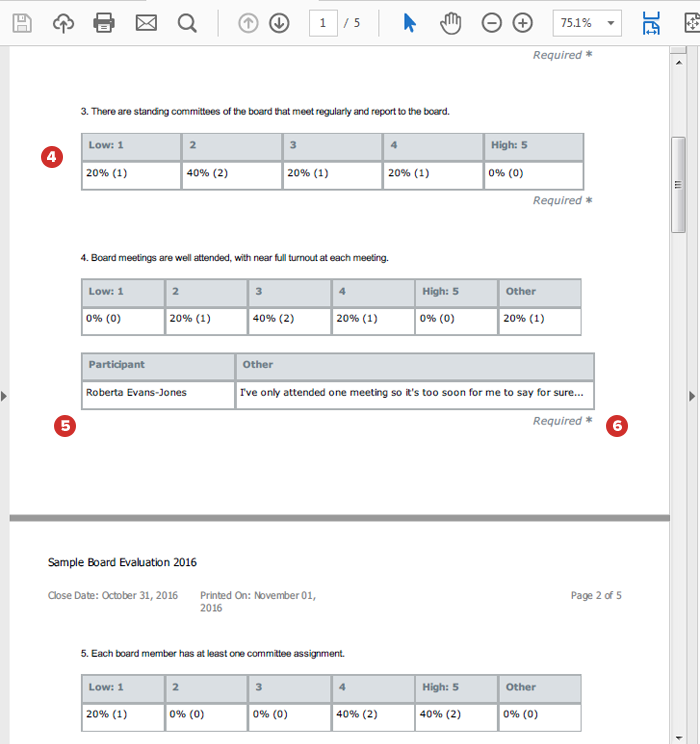
The Tabular report displays response percentage and sum data in a simple, text-only format.
Note
Checkbox (multi-select) questions only display sums, not percentages, on all report types.
-
If a list question included a text option, like a comment or an "Other" response, those responses are displayed along with the participant's name below that question.
-
All PDF reports include question number, title, and text, and state whether a question was required.
-
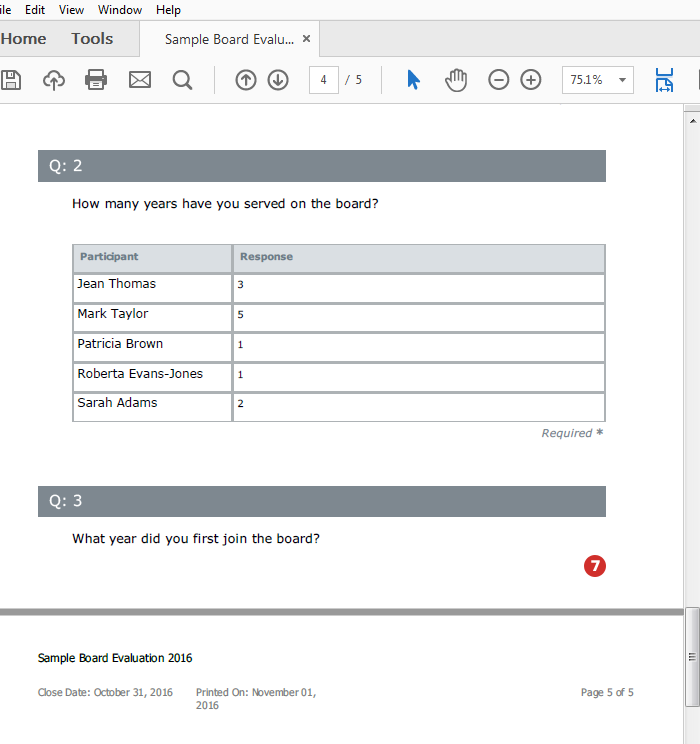
All PDF reports include responses to non-list, text-based questions, displayed in the order in which they appear in the evaluation.
Find out if your board assessment practices stack up to modern governance. Take a three-minute quiz to get your score.