Dashboards in Asset Manager
The Asset Manager app displays multiple charts showcasing the assets, providing you with a holistic view that aids in making critical strategic decisions.
Where are the charts?
There are four places in the Asset Manager app where you can view the charts:
Charts on the Asset Manager home page
The Asset Manager home page displays four interactive charts. You can view assets by their workflow status, criticality level, and more.
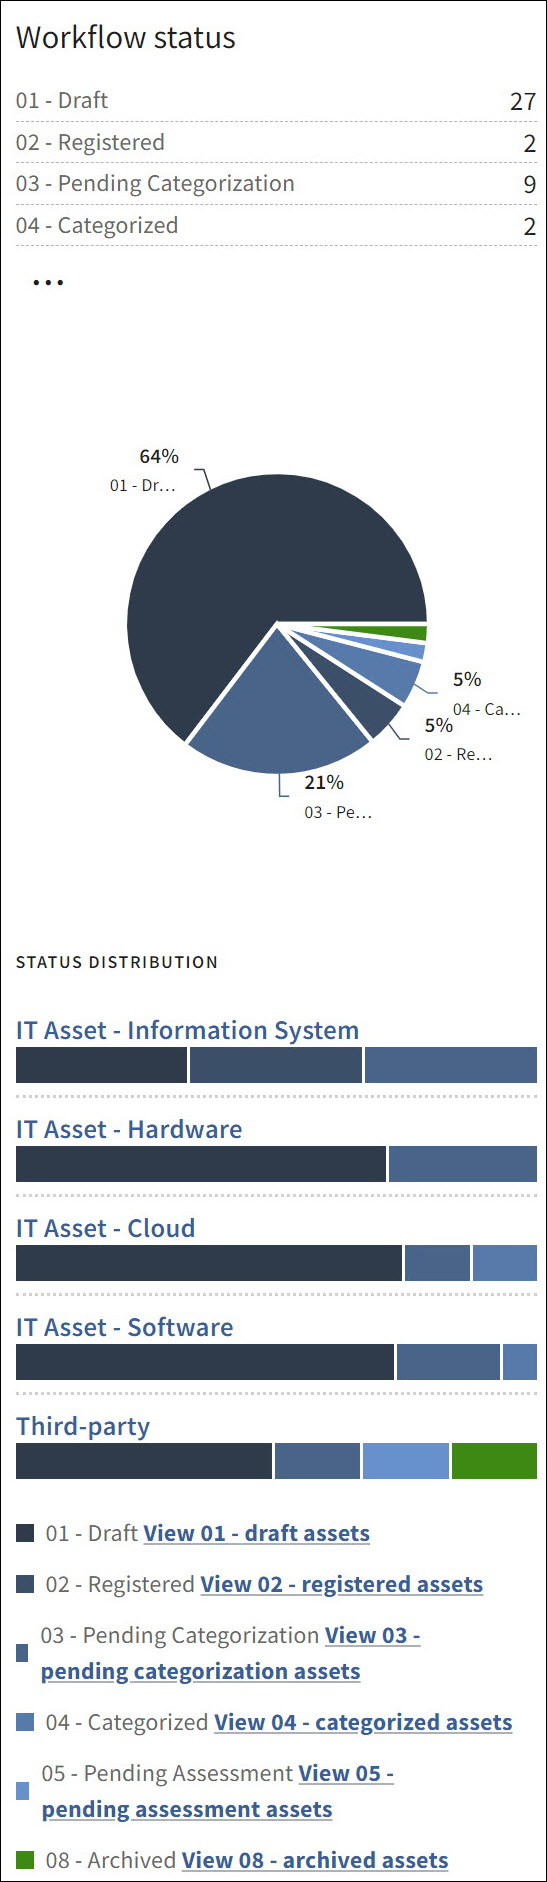
1. Workflow status
The following screenshot shows the workflow status charts:
- A pie chart displays the percentage of assets in each workflow status.
- A horizontal bar chart shows the number of assets in each asset type, categorized by workflow status.
Tip
Customize the colors and other details of the Workflow status options in the Configuration page. Learn more.
Navigation options in Workflow status
- Hover over an asset type to view the asset count in that category and the asset distribution across different workflow statuses.
- Click on an asset type to view assets of only that type on the All assets page. For example, in the above image, selecting IT Asset - Information System will take you to the All assets page with the IT Asset - Information System option applied in the Asset Type field, displaying only assets of that type.
- Click the links below the bar chart to filter assets by specific workflow status. For example, in the above image, selecting View 01 - draft assets will take you to the All assets page with the Draft option applied in the Workflow Status field, displaying only assets in draft status.
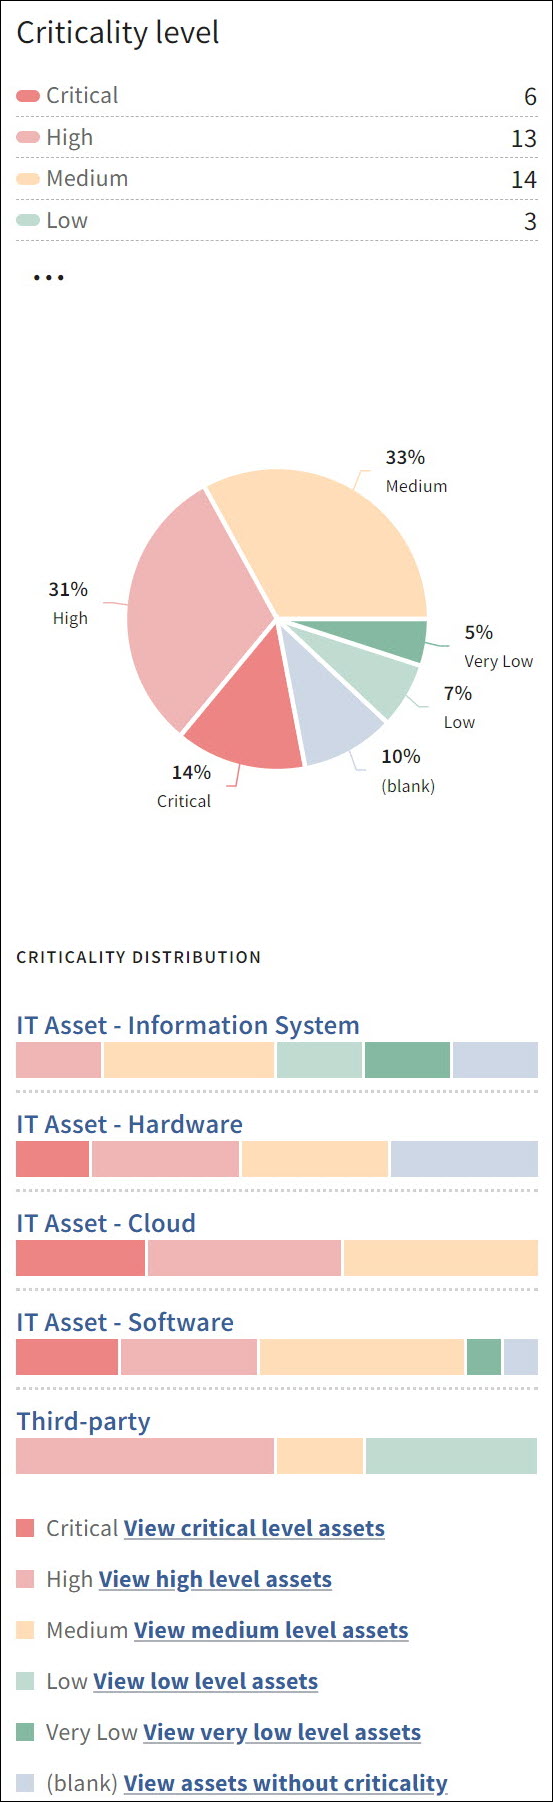
2. Criticality level
The following screenshot shows the criticality level charts:
- A pie chart shows the percentage of assets in each criticality level.
- A horizontal bar chart shows the number of assets in each asset type, categorized by criticality level.
Tip
Customize the colors and other details of the Criticality level options in the Configuration page. Learn more.
Navigation options in Criticality level
- Hover over an asset type to view the asset count in that category and the asset distribution across different criticality levels.
- Click on an asset type to view assets of only that type on the All assets page. For example, in the above image, selecting IT Asset - Information System will take you to the All assets page with the IT Asset - Information System option applied in the Asset Type field, displaying only assets of that type.
- Click the links below the bar chart to filter assets by specific criticality level. For example, in the above image, selecting View critical level assets will take you to the All assets page with the Critical option applied in the Criticality Level field, displaying only assets in critical level.
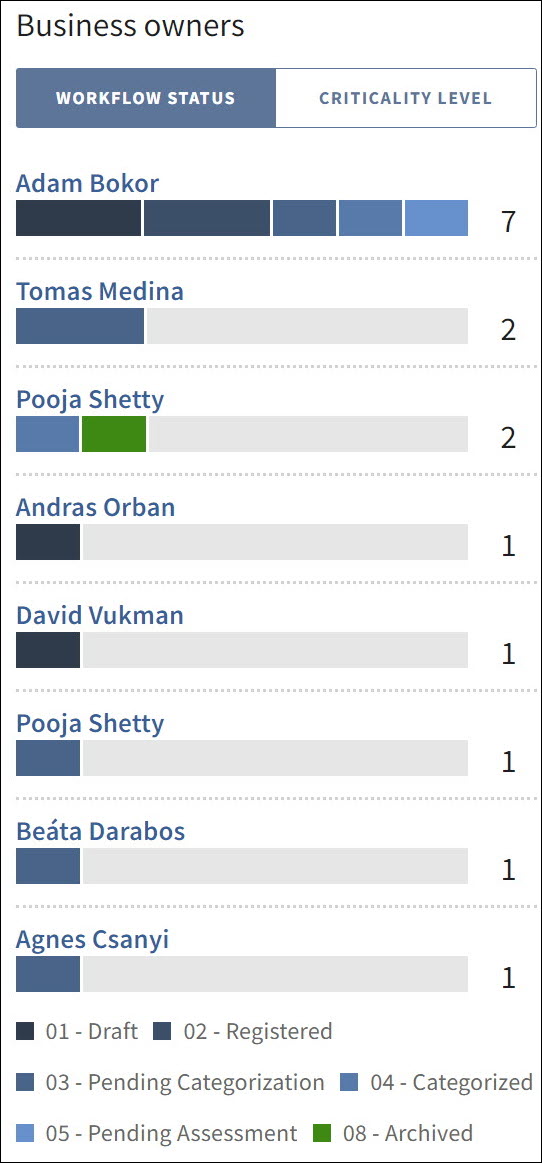
3. Business owners
The following screenshot shows the business owners charts:
- A horizontal bar chart shows the number of assets owned by each business owner, categorized by workflow status.
- A horizontal bar chart shows the number of assets owned by each business owner, categorized by criticality level.
Tip
Customize the colors and other details of the Workflow status and Criticality Level options in the Configuration page. Learn more.
Navigation options in Business owners
Workflow status
- Hover over a business owner to view their asset count and the asset distribution across different workflow statuses.
- Click on a business owner to view only their assets on the All assets page.
Criticality level
- Hover over a business owner to view their asset count and the asset distribution across different criticality levels.
- Click on a business owner to view only their assets on the All assets page.
4. Asset distribution by business unit
The following screenshot shows the Asset distribution by business unit chart.
This is a vertical bar chart that shows the number of assets by each business unit, categorized by asset type.
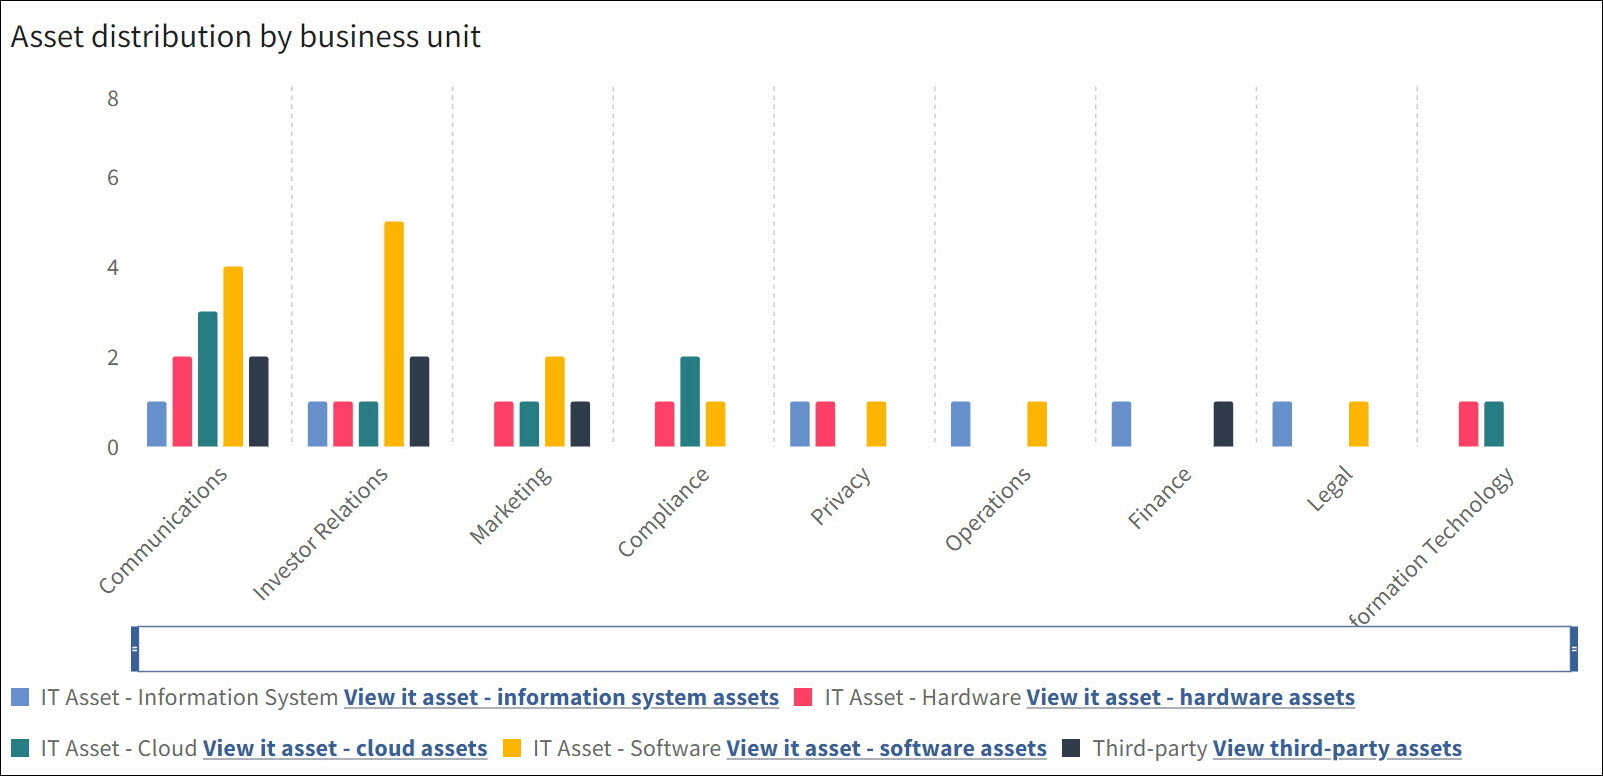
You cannot customize the colors of asset types.
Navigation options in Asset distribution by business unit
- Hover over a business unit to view the asset count in that category and the asset distribution across different asset types.
- Click the links below the chart to filter assets by their respective asset types. For example, in the above image, selecting View it asset - information system assets will take you to the All assets page with the IT Asset - Information System option applied in the Asset Type field, displaying only assets of that type.
- The horizontal scroll bar between the chart bars and the links allows you to zoom in on the chart, you can do this by dragging the corners of the scroll bar horizontally. This is particularly useful when dealing with a large number of data points on the chart.
Charts in Asset Type Pages
The Asset Type pages (All assets, IT assets, and Third-party assets) display the following charts:
- Assets & Workflow Status A donut chart displays the percentage of assets in each workflow status. Click the links below the chart to filter assets by specific workflow status.
- Criticality Level A pie chart shows the percentage of assets in each criticality level. Click the links below the chart to filter assets by specific criticality level.
Tip
Customize the colors and other details of the Workflow status and Criticality level options in the Configuration page. Learn more.
Charts in Asset Details Page
The asset details page displays the following vulnerability charts. The data for these charts is imported from Tenable.
- Distribution of Vulnerabilities by Status Shows the current count of vulnerabilities in each status, such as overdue and open.
- Vulnerabilities Status: 3-Month Trend Displays the percentage distribution of vulnerabilities statuses over the past 3 months.
Where does the data come from?
Charts display data based on the details you have provided for an asset. Add or update the following details when adding or modifying an asset.
- Workflow status This is the current state of an asset, for example: draft, registered. For more information, see Managing workflows in Asset Manager.
- Criticality level This is the level of importance of an asset. You can either provide this manually in the asset details or let the application calculate it. For more information, see Working with assets in Asset Manager.
- Business owners This is the owner of an asset. This field is part of the asset details.
- Business unit This is the business unit of an asset. This field is also part of the asset details.
For optimal chart appearance:
- Ensure your asset types are associated with criticality level, business owner / business owner (required), and business unit.
- Complete all necessary details, including criticality level, business owner, and business unit for each asset.
Customize the Workflow status and Criticality level options
By default, the options in the Workflow status and Criticality level are assigned colors, but you can customize them, along with other details like name, description, and score, in the Configuration page.
Workflow status options
The workflow status options are available in two workflows, namely: IT Asset Categorization Assessment and Third-party Categorization.
To update the workflow status options, perform the following steps:
Important
You must be a System Admin in Diligent One to access the Configuration page.
-
Open the Platform home page (www.diligentoneplatform.com).
Note
Diligent One Platform also supports the domain www.highbond.com. For more information, see Supported domains.
Note
If your company uses more than one instance in Platform home, make sure the appropriate instance is active.
- Select Platform Settings > Configuration.
- Click on Workflows. The workflows page lists all the existing workflows.
- Click IT Asset Categorization Assessment.
- Under Statuses, click the status name you want to work with (for example: Draft).
- Click Edit and modify the details as required, such as name, description, color code, and order. For the best color combination, see Recommended colors.
- After making all the changes, click Save.
- Repeat steps 5 to 7 to update all the statuses in the IT Asset Categorization Assessment workflow.
- Follow the same steps to update the workflow status options in the Third-party Categorization workflow.
Criticality level options
To update the criticality level options, perform the following steps:
Important
You must have a System Admin user type in Diligent One to access the Configuration page.
-
Open the Platform home page (www.diligentoneplatform.com).
Note
Diligent One Platform also supports the domain www.highbond.com. For more information, see Supported domains.
Note
If your company uses more than one instance in Platform home, make sure the appropriate instance is active.
- Select Platform Settings > Configuration.
- Click on Attribute Types. The Attribute Types page lists all the existing attributes.
- Search and open Criticality Level.
- Click Edit and modify the details as required, such as name, score, and color code. For the best color combination, see Recommended colors.
- After making all the changes, click Save.
Recommended colors for the workflow status and criticality level options
The following table shows the recommended colors for the workflow status and criticality level options. Using these colors will enhance the look and feel of the charts.
Workflow status
| Workflow Status Name | Color Name | Color Code |
|---|---|---|
| 01 - Draft | Deep Blue |
|
| 02 - Registered | Navy Blue |
|
| 03 - Pending Categorization | Royal Blue |
|
| 04 - Categorized | Sky Blue |
|
| 05 - Pending Assessment | Cornflower Blue |
|
| 06 - Pending Review | Turquoise |
|
| 07 - Active | Teal |
|
| 08 - Archived | Olive Green |
|
Criticality level
| Criticality Level Name | Color Name | Hex Code |
|---|---|---|
| Critical | Red | #ED8584 |
| High | Pink |
|
| Medium | Amber |
|
| Low | Light Green |
|
| Very Low | Green |
|
Global filters and layout options
You can apply global filters and change your chart layout.
Applying global filters
There are two types of global filters: Asset type and Business Owner. These filters affect all the four charts on the page.
Follow these steps to apply filters:
-
From the Platform home page (www.diligentoneplatform.com), select the Asset Manager app to open it.
If you are already in Diligent One, you can use the left-hand navigation menu to switch to the Asset Manager app.
Note
Diligent One Platform also supports the domain www.highbond.com. For more information, see Supported domains.
- Select the desired Asset types and/or Business owners in their respective fields.
- Click Apply filters.
Result All charts will update to display the filtered data.
Changing chart layout
You can show or hide the charts using this option.
Follow these steps to change the layout:
To show or hide the charts
-
From the Platform home page (www.diligentoneplatform.com), select the Asset Manager app to open it.
If you are already in Diligent One, you can use the left-hand navigation menu to switch to the Asset Manager app.
Note
Diligent One Platform also supports the domain www.highbond.com. For more information, see Supported domains.
- Click Layout.
The Edit layout dialog box opens
- Select / deselect the desired options and click Apply.
Result The chart layout will update based on your selection.
To reset to default layout
If you want to go back to the default layout, click Reset Layout in the Edit layout dialog box and then click Apply.