Applying chart brushing to filter data
In the Reports app, chart brushing is an interactive method of filtering that allows Report Readers to define what they want to see or remove by highlighting a particular area on a chart.
How it works
Once a Report Writer has added a chart to a report, and activated the report, any Reports user with access to the chart can apply chart brushing to filter data. Filtering data involves selecting a particular area on a chart, and choosing whether to include or exclude the selected data.
If the Report Writer sets up a dashboard with a chart, and links chart brushing to the dashboard, Reports users can apply chart brushing to filter all charts and tables on the dashboard.
For more information, see Configuring filters in dashboards.
Limitations
Chart brushing cannot be applied on the following charts:
- Histogram
- Z Chart
- Meter charts
- Waterfall
- Event
- Week Density
- Trellis (no support for Exclude chart brushing)
- Auto Charts (no support for Exclude chart brushing)
Chart brushing is not supported for charts in Drill Anywhere and Drill Through reports.
Filtering data in a chart
Scenario
You are viewing a chart containing issue severity data, and you want to filter the data so you can focus on two particular projects:
- Cybersecurity Review
- Internal Policy Management - HR
Process
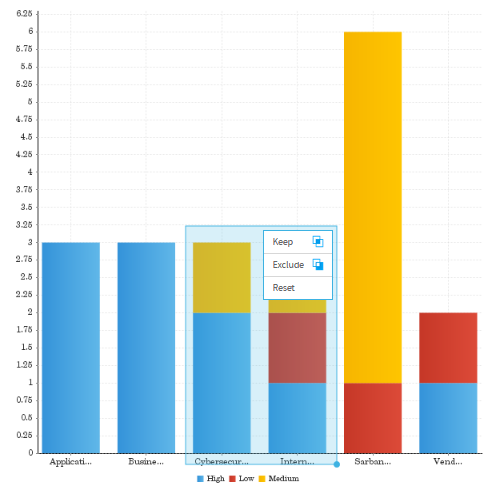
You apply chart brushing to the selected data by highlighting the appropriate area in the chart, and selecting Keep:
Issue severity by project
Result
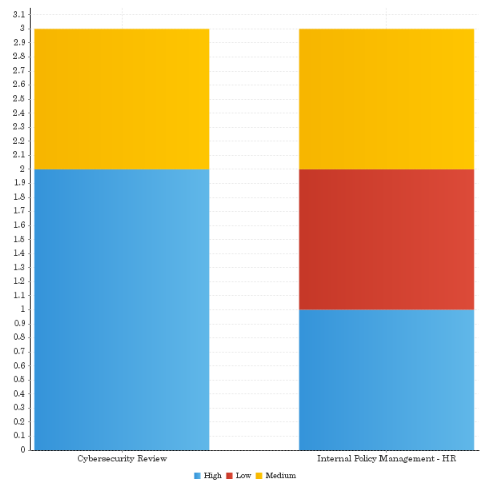
The chart is filtered:
Issue severity by project
Permissions
Any Reports user with access to the chart can apply chart brushing to filter data.
Filter data in a chart
-
From the Launchpad home page (www.highbond.com), select the Reports app to open it.
If you are already in Diligent One, you can use the left-hand navigation menu to switch to the Reports app.
- Navigate to a chart in a report or on a dashboard.
- Click and drag your mouse to highlight an area on the chart.
The chart brushing options Keep, Exclude, and Reset display.
- Choose one of the following options:
- Keep shows only the selected data
- Exclude shows the whole chart but excludes the selected data
- Reset resets the chart to its original state
Result Chart data is filtered.