Configuring filters in dashboards
Define relationships between reports on a dashboard to allow Report Readers to filter data across multiple tables and charts.
How it works
Once you have created a Standard Tab, and added reports to your dashboard, you can define different types of relationships between the reports on the dashboard to provide Report Readers with interactive ways to filter data.
Methods for filtering data in dashboards
| I want to allow Report Readers to... | Pre-requisite tasks | Steps |
|---|---|---|
| specify filter values and filter data across multiple tables and charts on a dashboard |
You must configure User Prompt filters in the reports before you can link them on a dashboard. For more information, see Configuring filters in reports. |
Link report filters to a dashboard |
|
select a particular area on a chart, choose whether to include or exclude the selected data, and filter data across multiple charts on a dashboard |
|
Link chart brushing to a dashboard |
You can add Drill Anywhere and Drill Through reports to a dashboard to allow Report Readers to drill into more detailed reports. For information on setting up Drill Anywhere and Drill Through reports, see Creating Drill Anywhere reports and Creating Drill Through reports.
Examples
Scenario
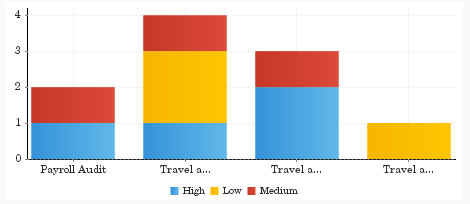
You are a Report Reader viewing two charts containing issues data, and you want to filter the data to focus on information pertaining to Payroll Audit.
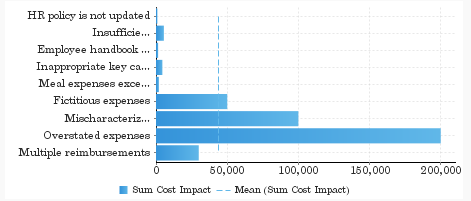
Issue severity by project
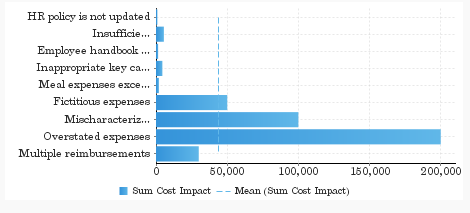
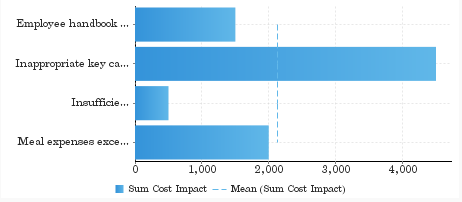
Average cost impact for issues
Process
A Report Writer previously linked report filters to the dashboard so you can easily filter both reports on the dashboard.
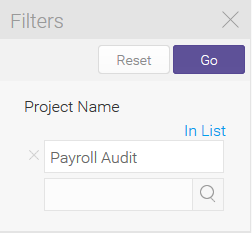
You specify Payroll Audit as the filter value:
Result
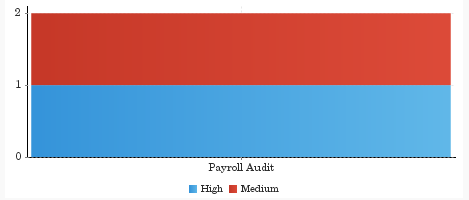
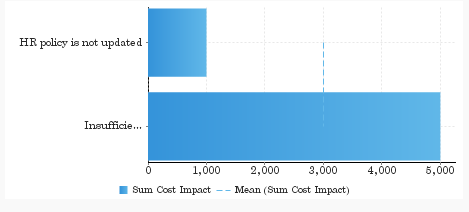
Both charts are filtered:
Issue severity by project
Average cost impact for issues
Scenario
You are a Report Reader viewing two charts containing issues data, and you want to filter the data to focus on information pertaining to the Travel and Entertainment Audit project.
Process
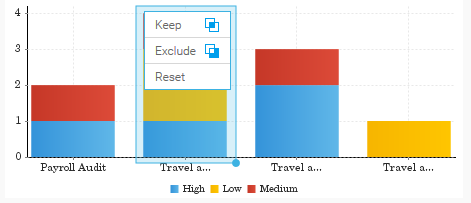
A Report Writer previously linked chart brushing to the dashboard so you can easily filter both charts on the dashboard. The Report Writer enabled chart brushing on the Issue Severity by Project Stacked Bar Chart.
You apply chart brushing to the selected data by highlighting the appropriate area in the chart, and selecting Keep:
Issue severity by project
Average cost impact for issues
Result
Both charts are filtered:
Issue severity by project
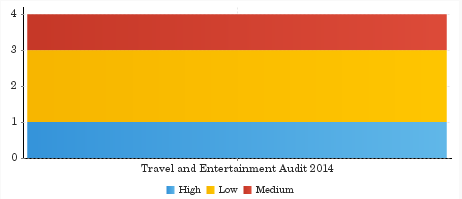
Average cost impact for issues
Permissions
Only Report Admins and Report Writers can define relationships between reports on a dashboard.
Link report filters to a dashboard
-
From the Launchpad home page (www.highbond.com), select the Reports app to open it.
If you are already in Diligent One, you can use the left-hand navigation menu to switch to the Reports app.
- Open an existing dashboard.
- From the dashboard, click the down arrow
 next to the dashboard tab name, and select Edit.
 - Ensure you have at least two reports with User Prompt filters on the dashboard. For more information, see Configuring filters in reports.
Note
The reports must contain filters that can be used across all data sets in the dashboard.
- In the left side navigation, click Filters
 to open the filters panel.
Note
to open the filters panel.
NoteTo see the left side navigation filter button, the Left Filters toggle in the Dashboard Properties panel must be enabled.
- In the Filters panel, click +Filter > Filter to add filters attached to your reports.
The Available Reports dialog box opens.
- Select the filters you want and click Add Filters.
The filters get added in the Filters panel.
- Click Link Filters.
The Link Filters dialog box opens.
- Select the options to link filters to the dashboard filters and click Apply.
Link chart brushing to a dashboard
-
From the Launchpad home page (www.highbond.com), select the Reports app to open it.
If you are already in Diligent One, you can use the left-hand navigation menu to switch to the Reports app.
- Open an existing dashboard.
- From the dashboard, click the down arrow next to the dashboard tab name, and select Edit.
- Ensure you have at least two reports with User Prompt filters on the dashboard. For more information, see Configuring filters in reports.
Note
The reports must contain filters that can be used across all data sets in the dashboard.
- In the left side navigation, click Filters to open the filters panel.
Note
To see the left side navigation filter button, the Left Filters toggle in the Dashboard Properties panel must be enabled.
- In the Filters panel, click +Filter > Filter to add filters attached to your reports.
The Available Reports dialog box opens.
- Select the filters you want and click Add Filters.
The filters get added in the Filters panel.
- Click Link Filters.
The Link Filters dialog box opens.
- Select the options to link filters to the dashboard filters and click Apply.
- Click on the report with the filters and in the Report Properties panel, click Link Interactions.
- Select the filters you want and click Apply.