Filtering storyboards
You may want to view a storyboard from a single perspective, such as region or quarter. Using storyboard filters, you can apply a filter across one or more tables based on fields they have in common.
How it works
Adding filters based on fields in source tables
Storyboards display visualizations and metrics that are based on tables in Results. When you create a filter, you select a field from one or more of these tables to filter on.
Records in the underlying table that satisfy the filter are included in the storyboard. Those that do not satisfy the filter are excluded.
Applying filters when viewing a storyboard
Once you create a filter, it is added to the filter panel.
Viewers specify the filter value or condition that includes records in the storyboard. When a viewer applies the filter, any visualizations or metrics that use the selected fields are updated.
Combining filters
Multiple filters are combined using and logic. Records from the tables must satisfy all applied filters to be included.
Results filters vs storyboard filters
Filters applied in Results take precedence over storyboard filters:
- filters inside interpretations
- filters inside metric configurations
Your storyboards will not show data that have already been filtered out of the underlying interpretations in Results.
Note
Records excluded from a Results interpretation using a Results filter still appear as options in the storyboard filter. If someone viewing your storyboard includes any of these records in a global filter, the charts or metrics associated with the local filter do not display any data.
For more information about how tables relate to interpretations and visualizations, see Interpretations and visualizations.
Example
Filtering a storyboard by region
You create a storyboard that uses data from two tables: subscribers and subscriptions. Each table contains a field called region. There are three charts on the storyboard and one metric:
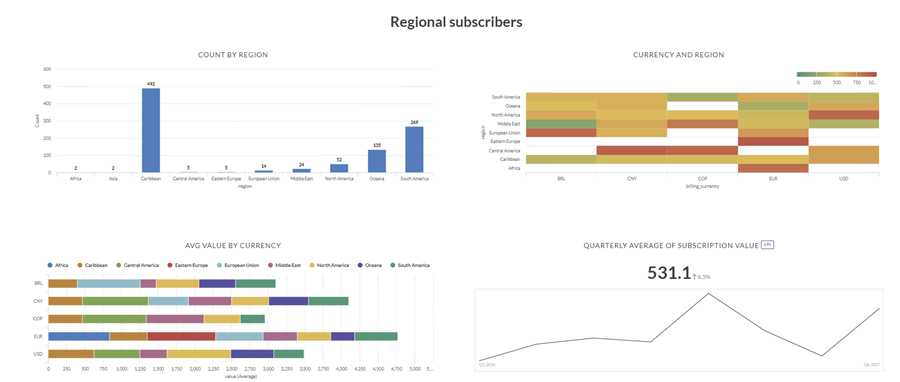
When you present the storyboard, you want to show data for the specific region that your audience is interested in. To do this, you create a filter that uses the region field from both tables:
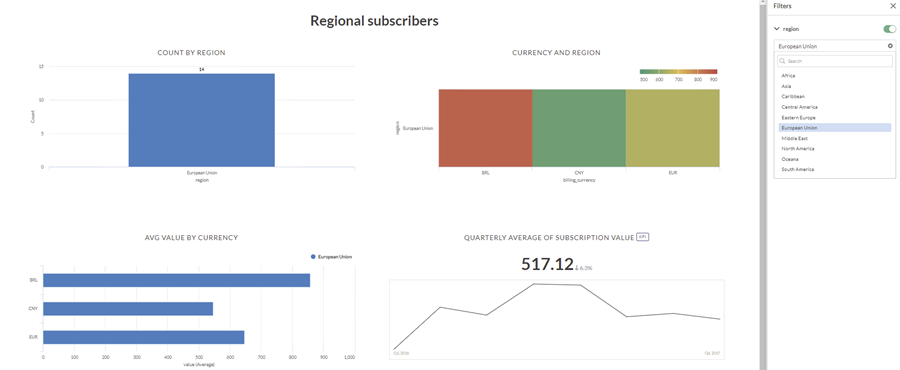
Once the filter is created, any viewer can select a specific region to view. When the filter is applied, the entire storyboard updates based on the selection:
Add a filter
-
From the Launchpad home page (www.diligentoneplatform.com), select the Storyboards app to open it.
If you are already in Diligent One, you can use the left-hand navigation menu to switch to the Storyboards app.
Note
Diligent One Platform also supports the domain www.highbond.com. For more information, see Supported domains.
- Open a storyboard in Edit mode and in the upper-right corner, click Filter Storyboard
 .
. - On the Filters panel, click Add Filter.
The Add Filter sub-panel opens.
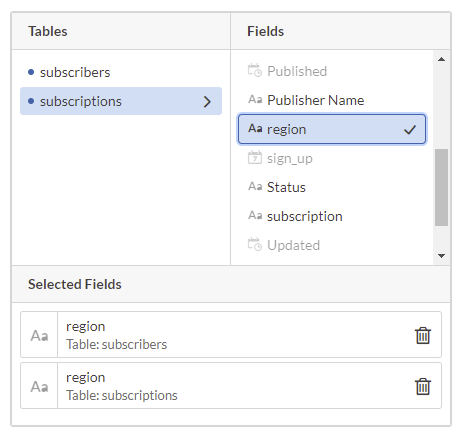
- From the Tables list, select a table and then from the Fields list, select the field to filter on.
- Optional: If the field appears in more than one table, repeat step 3 for each table that contains the field. You must select the field in each table to filter the entire storyboard. The fields you select must match the data type of the first field you selected. A single filter does not support multiple data types.
- In Choose your filter name field, the name of the table field selected is assigned as the filter name.
- Optional. If you are filtering on a numeric or date field, from the Choose your filter format field, select the display format to apply to the values.
- Choose a filter type for the filter:
- Multi Select the viewer may select one or more values to determine which records to include
- Conditional the viewer may specify a conditional operator and test value to determine which records to include
Note
Conditional operators are based on the data type of the filter field.
For example, for a numeric field the viewer can use a Less than condition.
For date and datetime fields, the viewer can use the Relative condition to select a relative date such as Last 2 Weeks, Next 3 Quarters, etc.
For more information about relative dates, see What do relative dates mean?
- Optional Single Select the viewer may select one value to include to determine which records to include
- Mandatory Single Select the viewer must select one value to include
Tip
Mandatory filters are useful if your storyboard must be viewed from a filtered perspective to be meaningful. For example, when the filter options show sets of data that would not make sense if viewed together.
-
At the bottom of the panel, click Add filter.
-
Add the filter by selecting the required values, and click Apply Filters.
Tip
For the Multi Select filter type, you can use the Select All option to select or clear all the values in one click.
- To publish the change for viewers, in the upper-right corner of the page, click Save and then Save again.
What do relative dates mean?
The following table shows the relative dates and their description.
Table Legend
- Day starts at 12:00:00 AM and ends at 11:59:59 PM.
- Week starts on Monday and ends on Sunday.
- Calendar quarter equals Jan-Mar, Apr-Jun, Jul-Sep, and Oct-Dec.
- n = the number you enter.
| Relative Date | Description | |
|---|---|---|
| Current |
Day |
Current Day starts at 12:00:00 AM on the current day and continues for 24 hours. |
| Week |
Current Week starts at 12:00:00 AM on the first day of the current week and continues for 7 days. |
|
| Month |
Current Month starts at 12:00:00 AM on the first day of the current month and continues for all the days of that month. |
|
| Quarter |
Current Quarter starts at 12:00:00 AM on the first day of the current calendar quarter and continues to the end of the quarter. |
|
| Year |
Current Year starts at 12:00:00 AM on January 1st of the current year and continues up to the end of December 31st of the current year. |
|
| Last |
Day(s) |
Last Day starts at 12:00:00 AM on the day before the current day and continues for 24 hours. Last n Days: For a date field, this starts at 12:00:00 AM, n days before the current day and ends at 11:59:59 PM of the current day. For a datetime field, this starts at 12:00:00 AM, n days before the current day and ends at the current time of the current day. Example: Last 2 Days = July 20 to July 22 (when current date is July 22). Note Click Exclude Today to omit current date from the calculation. Example: Last 2 Days = July 20 to July 21 (when current date is July 22 and Exclude Today is checked). |
| Week(s) |
Last Week starts at 12:00:00 AM on the first day of the week before the current week and continues for seven days. Last n Weeks starts at 12:00:00 AM on the first day of the week that started n weeks before the current week and continues up to 11:59:59 PM on the last day of the week before the current week. Example: Last 2 Weeks = July 6 to July 19 (when current date is July 22). |
|
| Month(s) |
Last Month starts at 12:00:00 AM on the first day of the month before the current month and continues for all the days of that month. Last n Months starts at 12:00:00 AM on the first day of the month that started n months before the current month and continues up to 11:59:59 PM on the last day of the month before the current month. Example: Last 2 Months = May 1 to June 30 (when current date is July 22). |
|
| Quarter(s) |
Last Quarter starts at 12:00:00 AM on the first day of the calendar quarter before the current calendar quarter and continues up to the end of that quarter. Last n Quarters starts at 12:00:00 AM on the first day of the calendar quarter n quarters ago and continues up to the end of the calendar quarter before the current quarter. Example: Last 2 Quarters = Jan 1 to June 30 (when current date is July 22). |
|
| Year(s) |
Last Year starts at 12:00:00 AM on January 1st of the year before the current year and continues through the end of December 31st of that year. Last n Years starts at 12:00:00 AM on January 1st, n + 1 years ago. The range ends on December 31st of the year before the current year. Example: Last 2 Years = Jan 1, 2018 to Dec 31, 2019 (when current date is July 22, 2020). |
|
| Next |
Day(s) |
Next Day starts at 12:00:00 AM on the day after the current day and continues for 24 hours. Next n Days: For a date field, this starts at 12:00:00 AM of the current day and continues for n days. For a datetime field, this starts at the current time of the current day and continues for n days. Example: Next 2 Days = July 22 to July 24 (when current date is July 22). Note Click Exclude Today to omit current date from the calculation. Example: Next 2 Days = July 23 to July 24 (when current date is July 22 and Exclude Today is checked). |
| Week(s) |
Next Week starts at 12:00:00 AM on the first day of the week after the current week and continues for seven days. Next n Weeks starts at 12:00:00 AM on the first day of the week after the current week and continues for n weeks. Example: Next 2 Weeks = July 27 to Aug 9 (when current date is July 22). |
|
| Month(s) |
Next Month starts at 12:00:00 AM on the first day of the month after the current month and continues for all the days of that month. Next n Months starts at 12:00:00 AM on the first day of the month after the current month and continues until the end of the nth month. Example: Next 2 Months = Aug 1 to Sep 30 (when current date is July 22). |
|
| Quarter(s) |
Next Quarter starts at 12:00:00 AM on the first day of the calendar quarter after the current calendar quarter and continues to the end of that quarter. Next n Quarters starts at 12:00:00 AM on the first day of the calendar quarter after the current quarter and continues up to the end of the nth quarter. Example: Next 2 Quarters = July 1 to Dec 31 (when current date is June 22). |
|
| Year(s) |
Next Year starts at 12:00:00 AM on January 1st of the year after the current year and continues through the end of December 31st of that year. Next n Years starts at 12:00:00 AM on January 1st of the year after the current year and continues through the end of December 31st of the nth year. Example: Next 2 Years = Jan 1, 2021 to Dec 31, 2022 (when current date is July 22, 2020). |
|
Dynamic filtering in Storyboard filters
When you have multiple filters in a storyboard and you apply one filter, then the values in the subsequent filters will get updated based on the options selected in the first filter.
For example: You have a storyboard that uses a table with the following data:
| Country | State | City |
|---|---|---|
| India | Karnataka | Bangalore |
| India | Karnataka | Bangalore |
| India | Karnataka | Bangalore |
| India | Goa | Vasco |
| India | Odisha | Bhubaneshwar |
| India | Odisha | Puri |
| USA | Alabama | Addison |
| USA | California | San Jose |
| USA | Colorado | Aspen |
| USA | New Jersey | Toms River |
| Canada | - | - |
The storyboard has the following filters added of multi-select type: Country, State, and City.
Now, in the storyboard, you select India in the filter Country and click Apply Filters, then the values in the State and City filters are updated based on that value (India). Hence, the values related to USA and Canada are removed from the State and City filters.
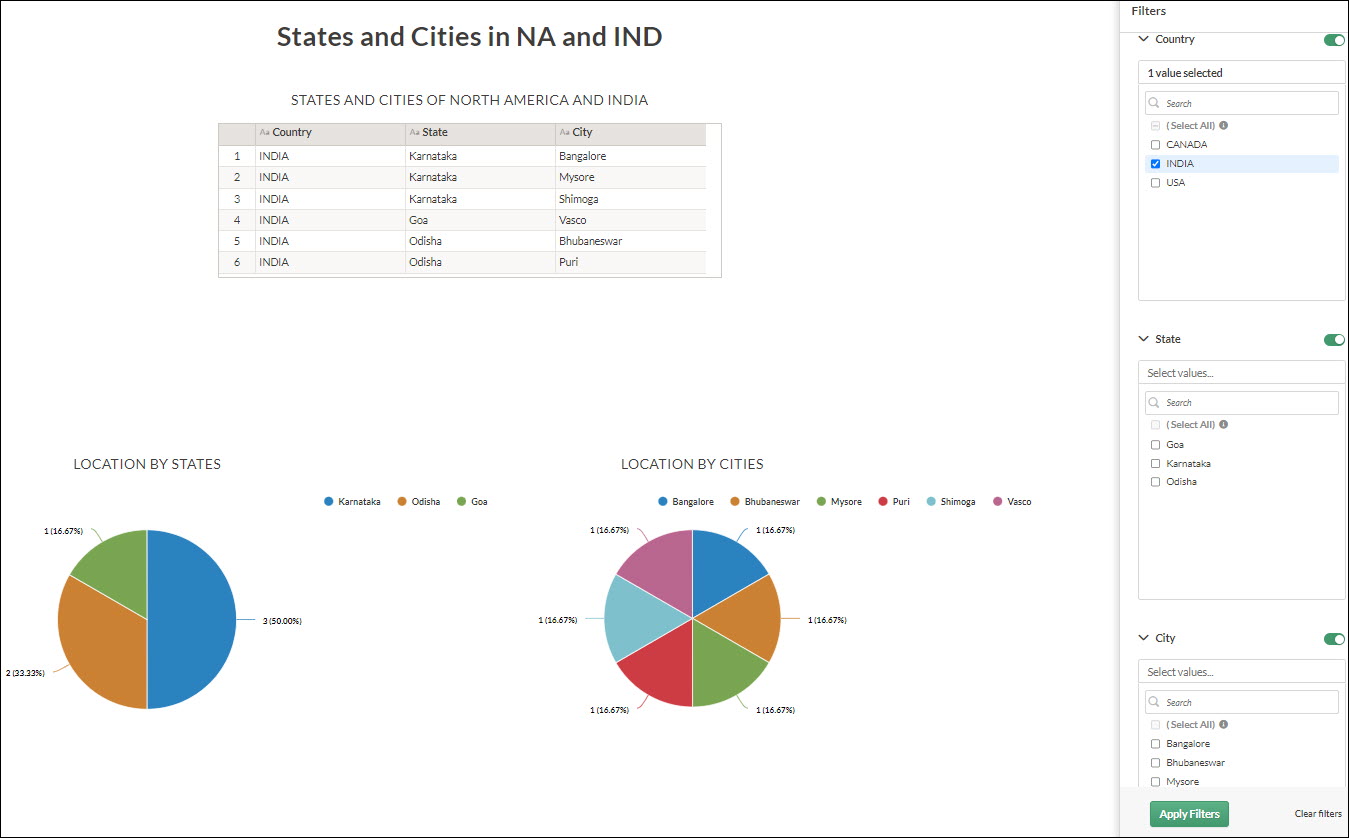
Likewise, when you select some values in the State filter and click Apply Filters, the values in the City filter are updated based on the values selected in the State and Country filters.
For example: In the above image, when you select Karnataka in the State filter and click Apply Filters, then in the City filter, the values: Bangalore, Mysore, and Shimoga will remain and the rest of the values (belonging to other states) will get cleared. Also, USA and Canada will get cleared from the Country filter.
Similarly, if you apply additional filters, based on the values selected, the rest of the filters will get updated.
Note
Dynamic filtering works best when you select the filter values and apply the filters. If you want to deselect some options and reapply the filters, it is recommended to clear the filters and start applying the filters afresh.
How to enable / disable dynamic filtering in Storyboards
-
From the Launchpad home page (www.diligentoneplatform.com), select the Storyboards app to open it.
If you are already in Diligent One, you can use the left-hand navigation menu to switch to the Storyboards app.
Note
Diligent One Platform also supports the domain www.highbond.com. For more information, see Supported domains.
- To turn on dynamic filtering, click the toggle Enable dynamic filtering in the Storyboard filters.
By default, dynamic filtering is turned off.
Result Dynamic filtering is enabled in all storyboards for all users.
- To turn off dynamic filtering, click the toggle again.
Limitation of dynamic filtering
When dynamic filtering is enabled in Storyboards, the Select All option (available in the Multi Select filter type) is disabled.
Set the default filter setting
-
From the Launchpad home page (www.diligentoneplatform.com), select the Storyboards app to open it.
If you are already in Diligent One, you can use the left-hand navigation menu to switch to the Storyboards app.
Note
Diligent One Platform also supports the domain www.highbond.com. For more information, see Supported domains.
- Open a storyboard in Edit mode and in the upper-right corner, click Filter Storyboard .
- Expand the filter you want to set the default selection for and set the filter value or condition.
- Optional. To test the filter, at the bottom of the pane, click Apply Filters.
- To save the default selection and publish the change for viewers, in the upper-right corner of the page, click Save and then Save again.
When viewers access the storyboard, the default filter setting is applied. The viewer can then select a different value or condition to change the data that is included.
Edit a filter
Note
To edit a filter, you must have access to all Results tables used in the filter. If you do not have access to all tables, the Edit Filter option is disabled.
-
From the Launchpad home page (www.diligentoneplatform.com), select the Storyboards app to open it.
If you are already in Diligent One, you can use the left-hand navigation menu to switch to the Storyboards app.
Note
Diligent One Platform also supports the domain www.highbond.com. For more information, see Supported domains.
- Open a storyboard in Edit mode and in the upper-right corner, click Filter Storyboard .
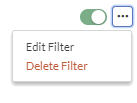
- Next to the filter you want to edit, click More > Edit Filter.
- Edit the filter settings and click Save Changes. For more information about filter settings, see Add a filter.
- To publish the change for viewers, in the upper-right corner of the page, click Save and then Save again.
Delete a filter
Tip
Instead of deleting a filter, you can disable the filter so that it is no longer active. To disable a filter, use the toggle ![]() and then click Apply Filters.
and then click Apply Filters.
-
From the Launchpad home page (www.diligentoneplatform.com), select the Storyboards app to open it.
If you are already in Diligent One, you can use the left-hand navigation menu to switch to the Storyboards app.
Note
Diligent One Platform also supports the domain www.highbond.com. For more information, see Supported domains.
- Open a storyboard in Edit mode and in the upper-right corner, click Filter Storyboard .
- Next to the filter you want to edit, click More > Delete Filter > Yes, delete.
- To publish the change for viewers, in the upper-right corner of the page, click Save and then Save again.
Filter a storyboard
Note
As a storyboard viewer, you can apply any filters that the storyboard creator or editor has added. You cannot add your own filters or change the configuration of any existing filters.
-
From the Launchpad home page (www.diligentoneplatform.com), select the Storyboards app to open it.
If you are already in Diligent One, you can use the left-hand navigation menu to switch to the Storyboards app.
Note
Diligent One Platform also supports the domain www.highbond.com. For more information, see Supported domains.
- Open a storyboard in View mode and in the upper-right corner, click Filter Storyboard .
- Expand the filter you want to use and select a filter value or condition.
Tip
Use the search field if you know the filter value you want to use.
- At the bottom of the pane, click Apply Filters.
You can also disable a filter. Use the toggle
 and then click Apply Filters.