Summary table
Summary tables group records on unique values in one or more key fields and then perform a count for the number of matching records. You can further drill into the summary by selecting a column and producing a crosstab. Once you define the summary, you can also select numeric fields to subtotal.
Tip
Summary tables most effective when you are comparing a limited number of categories.
When do you use it?
Frequency summaries
Select row key fields only and summarize tables to view the frequency of values across each unique combination of key fields.
Example
| Vendor State | Vendor Category | Count |
|---|---|---|
| TX | A | 3 |
| TX | B | 15 |
| CA | A | 47 |
| NY | F | 2 |
Cross-tabular summaries
Select row key fields as well as a column and create a crosstab that summarizes the relationship between two categorical variables by depicting the number of times each of the possible category combinations occurred in the data.
Example
| Class rank | Performance | ||
|---|---|---|---|
| <= 60% GPA | 60% to 79% GPA | >= 80% GPA | |
| Freshman | 32 | 60 | 15 |
| Sophomore | 25 | 70 | 23 |
| Junior | 40 | 60 | 10 |
| Senior | 15 | 45 | 30 |
Subtotals
Include values in the summary to find the sum of a numeric field for each of the possible category combinations in your data.
Data configuration settings
| Setting | Data types supported | Description |
|---|---|---|
| Column | All | The field used to include a second categorical variable for cross-tabular results. You can add one column to the summary table and create a crosstab, or leave the field blank to perform a simple one-dimensional summary. |
| Rows | All |
The fields used to group records. You can add between 0 and n rows and each record in the summary table represents a unique combination of the values from the selected fields. Note Summary table sorting depends on the order in which you select rows. The first row selection is sorted alphabetically or numerically by the values in the field you select. Within each subsequent selection, the row is sorted inside the preceding row using the same logic. |
| Values | Numeric |
The calculation to perform on the summary table data:
You can add between 0 and n value fields to the summary table. |
Chart display settings
-
From the Platform home page (www.diligentoneplatform.com), select the Results app to open it.
If you are already in Diligent One, you can use the left-hand navigation menu to switch to the Results app.
Note
Diligent One Platform also supports the domain www.highbond.com. For more information, see Supported domains.
- Navigate to the appropriate table.
- On the Configure
 panel, click Display and configure the following settings:
| Setting | Description |
|---|---|
| Options | |
| Show Totals | Show or hide the totals. |
Example
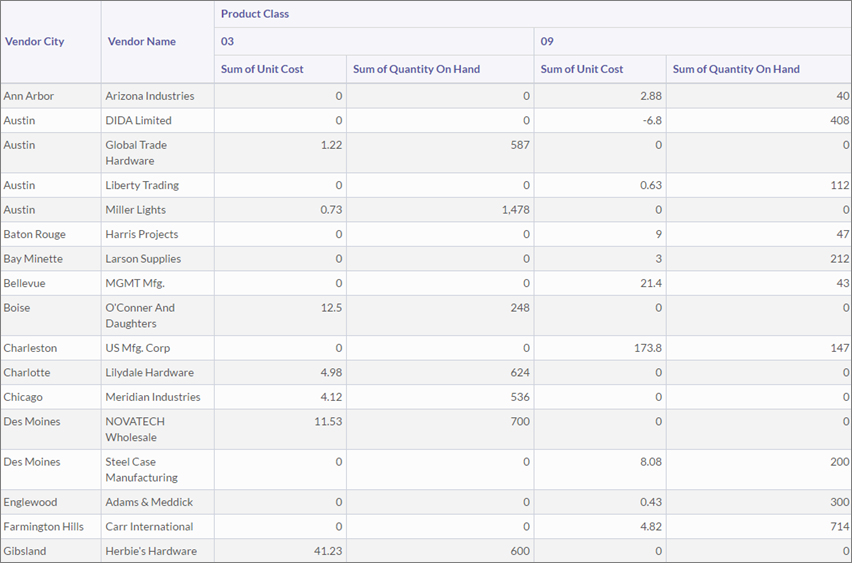
You are performing an analysis of inventory data and you need to review information about unit costs and quantities for different vendors in your vendor list. You are also interested in seeing how these numbers break down across product class and vendor city.
To capture this information in a single view, you create a summary table with the following settings:
- Column Product Class
- Rows Vendor City and Vendor Name
- Values Unit Cost and Quantity on Hand
The table summarizes the vendor data into the crosstab you defined and performs sum calculations for unit cost and quantity values. Rows are sorted first by Vendor City and then by Vendor Name inside each city: