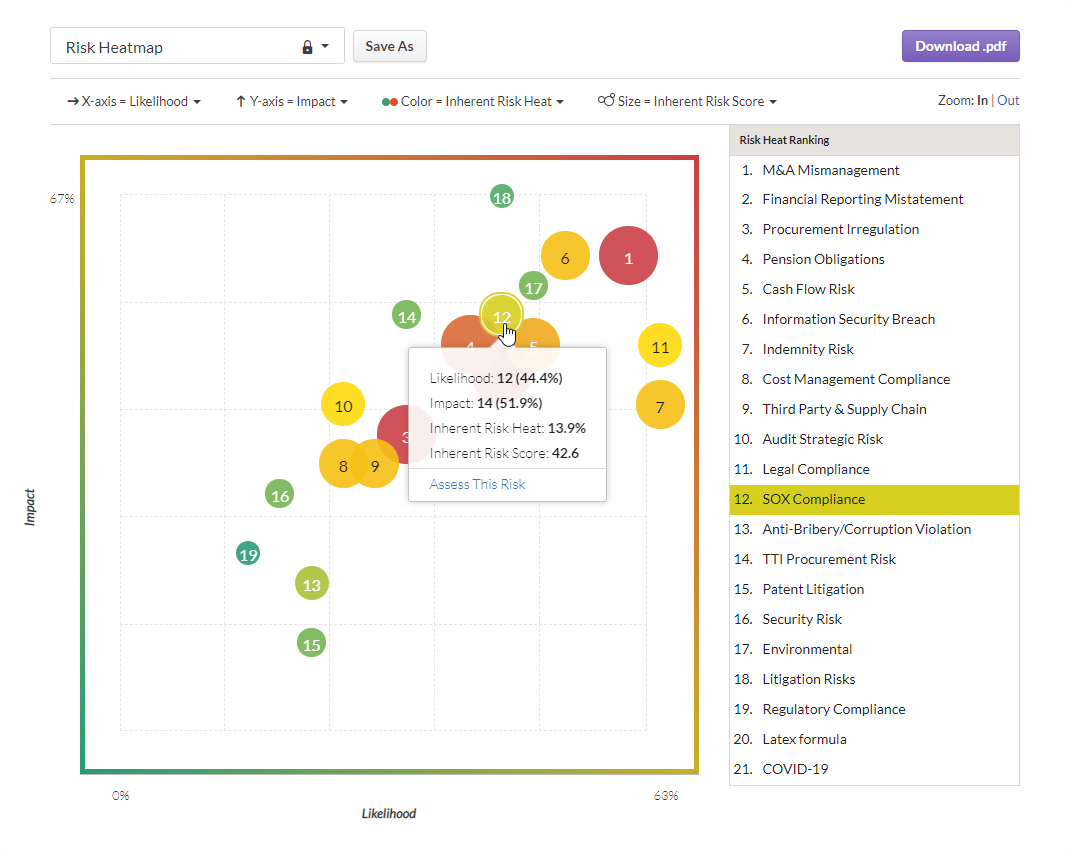
Understanding risk heatmaps
Visualize risk in the company to present the results of a risk assessment.
What is a risk heatmap?
Risk heatmaps are visualizations that present the results of a risk assessment.
In an enterprise risk assessment process, the ability to visualize risks helps to establish and communicate a holistic view of risks affecting the company. Risk heatmaps are often used to convey the potential likelihood and impact of risks so that strategic decisions can be made for the health of the company.
What does a risk heatmap display?
Once you have assessed risk in your company, the risk heatmap shows four relative values. The areas of greater concern are represented in the upper-right quadrant of the risk heatmap, and the areas of lower concern are represented in the lower right quadrant.
The default risk heatmap displays the following values: Likelihood, Impact, Inherent Risk Heat, Inherent Risk Score. You can configure risk heatmaps to display different values. For more information, see Configuring risk heatmaps.
X and Y-axis
The X-axis displays the likelihood percentage across all operating segments in the company and the Y-axis displays the impact percentage across all operating segments in the company.
By default, the percentages provide a normalized scale (between 0 and the highest assessed value) for Likelihood and Impact in the context of all operating segments in the company. Values are rounded to the next integer if greater than 1 and rounded up to the next tenth if less than 1.
However, you can also display your risk heatmap with a full 0-100% scale. For more information, see Configuring risk heatmaps.
Size
The size of the bubble represents the inherent risk score. The biggest bubble size represents the largest assessed value and the smallest bubble size represents with smallest assessed value. All values in between are sized incrementally in relation to the highest and lowest assessed values.
Example
Inherent risk score values range between 5-50%.
| Bubble size | Value |
|---|---|
| Largest | 50% |
| Smallest | 5% |
Color
The color of the bubble represents inherent risk heat. Red represents the largest assessed value and green represents the smallest assessed value. All values in between are colored using a color gradient scale.
Inherent Risk Heat values
Inherent risk heat values are represented in risk heatmaps using three numbers. For more information on how inherent risk heat is calculated, see Assessing risk.
Examples
| Values | Number of decimal places | Example |
|---|---|---|
| Between 0 and 9.99 | 2 | 5.55% |
| Between 10 and 99.9 | 1 | 55.5% |
| 100 | 0 | 100% |
Ranking
Risks are ranked from highest to lowest in the risk heatmap, based on the combined Likelihood and Impact values for each risk.
If the inherent risk score is the same for two or more risks within the list, the risks are ordered by inherent risk heat. If the inherent risk score and inherent risk heat is the same for two or more risks, the risks are ordered by risk ID in ascending order.
Likelihood and impact calculations
Likelihood and impact example
Likelihood is calculated by totaling the likelihood values divided by the total possible likelihood across all operating segments in the company. Similarly, Impact is calculated by totaling the impact values divided by the total possible impact across all operating segments in the company.
Risk scoring framework
| Risk Scoring Factor | Weight | Severity Scale |
|---|---|---|
| Likelihood | 100% | 3 point scale (1 = Low, 2 = Medium, 3 = High) |
| Impact | 100% | 3 point scale (1 = Low, 2 = Medium, 3 = High) |
| Velocity | 70% | 3 point scale (1 = Low, 2 = Medium, 3 = High) |
| Vulnerability | 60% | 3 point scale (1 = Low, 2 = Medium, 3 = High) |
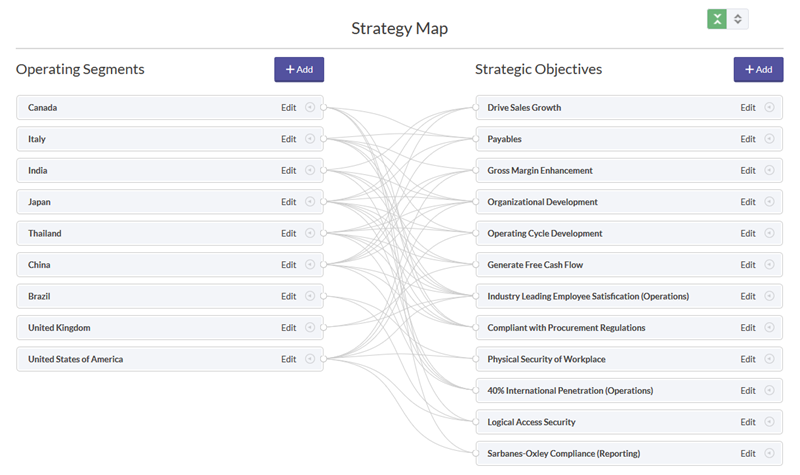
Strategy Map
Risk assessment
In the following risk assessment:
- the total Likelihood value is 12 (1 + 2 + 3 + 2 + 3 + 1).
- the total Impact value is 14 (3 + 2 + 3 + 2 + 3 + 1).
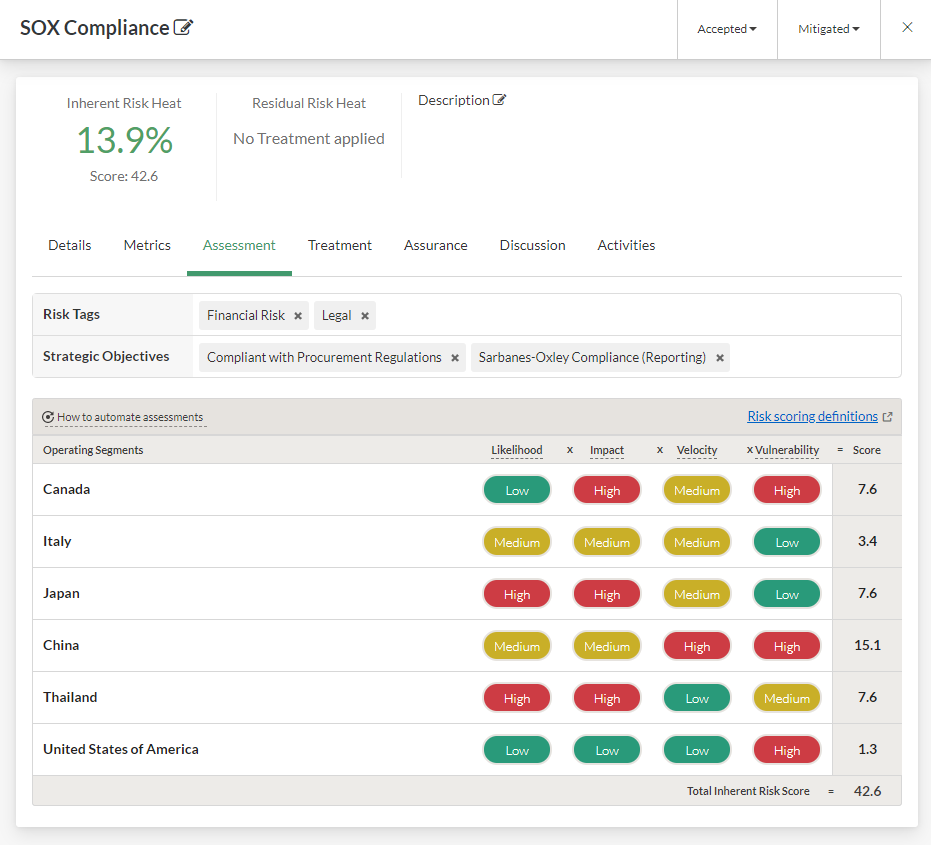
Likelihood calculation
The total possible Likelihood across all operating segments in the company is 27 (3 x 9).
When the total Likelihood value (12) is divided by the total possible Likelihood across all operating segments in the company (27), the result is 44.4%.
Impact calculation
The total possible Impact across all operating segments in the company is 27 (3 x 9).
When the total Impact value (14) is divided by the total possible Impact across all operating segments in the company (27), the result is 51.9%.
Risk heatmap