Visualizing risk aggregations on the Strategy Heatmap
Visualize the aggregation of risk in different areas of your company using the Strategy Heatmap.
How it works
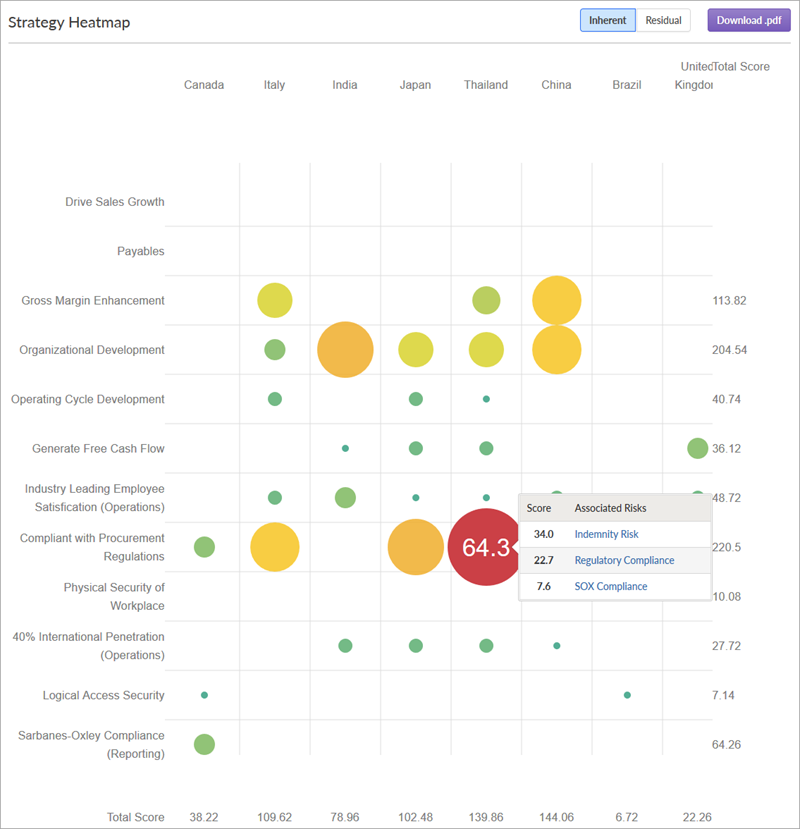
The Strategy Heatmap is a visualization that displays columns for each of your company's operating segments and rows for each of your company's strategic objectives. The Strategy Heatmap can display inherent or residual risk, but not both at the same time.
- The size of each bubble indicates the volume of clustered risks.
- The color of each bubble indicates the severity of clustered risks for each operating segment or strategic objective combination.
- The Total Score column displays the total inherent or residual risk score for each operating segment.
- The Total Score row displays the total inherent or residual risk score for each strategic objective.
Example
Visualizing risk aggregations in the Strategy Heatmap
Scenario
As an Executive in an international company, you need insight into the total inherent risk associated with different strategic objectives in various countries. At the moment, your focus is to visualize the aggregation of risk associated with procurement regulations compliance in Thailand.
Process
You navigate to the Strategy Heatmap, and hover your mouse over the bubble positioned in the intersection of Thailand and Compliant with Procurement Regulations.
Result
The total inherent risk score and associated risks display:
Permissions
All Strategy users can view the Strategy Heatmap.
Visualize risk aggregations using the Strategy Heatmap
-
From the Platform home page (www.diligentoneplatform.com), select the Strategy app to open it.
If you are already in Diligent One, you can use the left-hand navigation menu to switch to the Strategy app.
Note
Diligent One Platform also supports the domain www.highbond.com. For more information, see Supported domains.
- Select Heatmaps > Strategy Heatmap.
The Strategy Heatmap, noted with a lock
 beside it, cannot be deleted.
 - Click
 Filters.
 - Work with items in the Strategy Heatmap by completing any of the following tasks outlined in the table:
Note
- Interface terms are customizable, and fields and tabs are configurable. In your Diligent One organization, some terms, fields, and tabs may be different.
- If a required field is left blank, you will see a warning message: This field is required. Some custom fields may have default values.
Task Steps Remarks Switch between inherent and residual risk Click Inherent or Residual. If you have not yet defined treatments for your risks, you must do so before you can switch to the residual view. For help doing this, see Defining risk treatment. Open or close filter options. Click Filters. Filter risks by Inherent Risk Heat range. Click and drag the Inherent Risk Heat slider from the left and right to filter out values below and above a specified threshold.
The grey portion of the scale indicates the minimum and maximum values to display on the Strategy Heatmap.
For example, you can adjust the endpoints of the scale to show all aggregated risks within an individual area of your company that have inherent risk heat between 50%-70%.
Filter risks by keyword or tag. Enter a keyword or tag name in the Keywords/Tags field. You can filter risks using multiple search terms or tags. Filter risks by state. Select one or more states from the State dropdown list. Strategy Admins can customize the name of risk states under Settings > Risk Profile to align with your company's terminology. Filter risks by Operating Segments or Strategic Objectives. Select the appropriate options from the dropdown lists.
Operating Segments and Strategic Objectives are customizable terms under Settings > Strategy Map. View the state of risks at a particular point in time. Under Time Machine, click Choose a Date and select a date from the calendar. Time Machine shows data in read-only format. You cannot edit the historical data.
Remove all applied filters. Click Clear All. View the total inherent risk score for a particular functional area. Hover your cursor over a bubble. View a list of associated risks for a particular functional area, and their individual inherent risk scores. Click the appropriate bubble. Assess a risk or view risk details. Click the appropriate bubble, and click a risk under Associated Risks.
If you have not assessed residual risk, the Assessment tab opens by default.
If you have assessed residual risk, the Assurance tab opens by default, and you must click Assessment .
Generate a report showing the Strategy Heatmap. Click Download PDF. The report is generated and displayed in a new browser window. You can download the report to your computer. The file is saved as Strategy Heatmap - Inherent.pdf or Strategy Heatmap - Residual.pdf, depending on which option you are viewing.