Calculating sample size for a record sample
Before sampling a set of data, you must calculate the statistically appropriate sample size, and other values required by the subsequent sample and evaluate operations.
The Calculate Sample Size feature in Analytics calculates the required values for you based on input values you provide.
The importance of calculating a sample size
Calculating an appropriate sample size is critical to the validity of the subsequent sample. If the sample is not valid, or representative, you cannot reliably project the results of audit procedures you perform on the sample to the entire population.
Do not skip calculating a sample size, or guess at a sample size.
Most of the input values you use to calculate sample size are based on your professional judgment. Ensure that you fully understand the implications of the values before relying on the results of sampling in a production environment. Consult audit sampling resources, or an audit sampling specialist, if you are in doubt.
How input values affect sample size
Input values affect the sample size calculated by Analytics. You can use the Calculate button in the Size dialog box to experiment with how the different input values affect the sample size.
The table below summarizes the effect of input values on sample size.
Caution
In a production environment, do not manipulate input values solely to achieve a smaller sample size. Input values should be based on your professional judgment about what is most appropriate for the data being sampled and the audit objective.
| Increasing this input value: | Decreases sample size | Increases sample size |
|---|---|---|
| Confidence |
|
|
| Population | Has no effect on sample size | |
| Upper Error Limit (%) |
|
|
| Expected Error Rate (%) |
|
|
Steps
Note
Do not include the thousands separator, or the percentage sign, when you specify values. These characters prevent the command from running, or cause errors.
-
Select Sampling > Record/Monetary Unit Sampling > Calculate Size
Note
The menu option is disabled if a table is not open.
- On the Main tab, select Record.
- Enter the input values to use for calculating the sample size:
- Confidence
- Population
- Upper Error Limit (%)
- Expected Error Rate (%)
Note
The input values are explained in detail below.
- (Optional) Click Calculate to see a preview of the output results.
Tip
Clicking Calculate instead of OK allows you to experiment with different input values before outputting the results.
Note
The output results are explained in detail below.
- On the Output tab:
- In the To panel, select one of the following:
- Screen displays the results in the Analytics display area
- File saves or appends the results to a text file
The file is saved outside Analytics.
- If you selected File as the output type, do one of the following:
- Enter a file name in the Name text box.
- Click Name and enter the file name, or select an existing file in the Save or Save File As dialog box to overwrite or append to the file.
If Analytics prefills a file name, you can accept the prefilled name, or change it.
You can also specify an absolute or relative file path, or navigate to a different folder, to save or append the file in a location other than the project location. For example: C:\Results\Output.txt or Results\Output.txt.
Note
ASCII Text File or Unicode Text file (depending on which edition of Analytics you are using) is the only option for File Type.
- In the To panel, select one of the following:
- Click OK.
- If the overwrite prompt appears, select the appropriate option.
Size dialog box inputs and results
The tables below provide detailed information about the input values and output results in the Size dialog box.
Main tab – input values
|
Input values – Size dialog box |
Description |
|---|---|
| Confidence |
Your desired confidence level that the resulting sample is representative of the entire population. For example, entering 95 means that you want to be confident that 95% of the time the sample will in fact be representative. Confidence is the complement of “sampling risk”. A 95% confidence level is the same as a 5% sampling risk. |
| Population |
The number of records in the data set you are sampling. Note In record sampling, the population size does not affect the resulting sample size. For example, if the other input values remain the same, the same statistically valid sample size is calculated for populations of 150,000 or 1,000,000 records. The resulting interval value does increase in direct relation to the population size. |
|
Upper Error Limit (%) |
The maximum rate of deviation from a prescribed control that can occur and you still consider the control effective. For example, entering 5 means that the deviation rate must be greater than 5% for you to consider the control not effective. |
| Expected Error Rate (%) |
The rate of deviation from a prescribed control that you expect to find. For example, entering 1 means that you expect the deviation rate to be 1%. Note The Expected Error Rate (%) you specify must be less than the Upper Error Limit (%). If the difference between them is too small, the error message Error rate too high for calculation appears. In audit sampling terms, the degree of sampling precision represented by the difference is too small to be calculated for the confidence level you specified. |
Main tab – output results
|
Output results – Size dialog box |
Description |
|---|---|
| Sample Size | The required sample size. |
| Interval | The interval value – required for the fixed interval and the cell selection methods. |
| Number of Tolerable Errors |
The maximum number of errors or deviations that can occur in the resulting sample without exceeding the Upper Error Limit (%). For more information, see Number of Tolerable Errors. |
An example of inputs and results
Calculating the size of a record sample for the Vouchers table
The figure below provides an example of input values and output results when calculating sample size for record sampling.
The table contains 5298 records. Based on the other input values, the required sample size is 593 records.
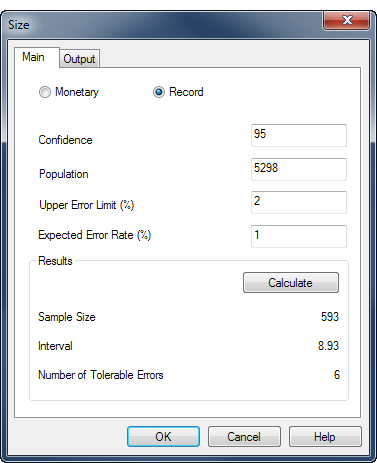
The calculation is based on the Vouchers table in ACL_Rockwood.acl (ACL DATA\Sample Data Files\ACL_Rockwood\ACL_Rockwood.acl).
Number of Tolerable Errors
Note
If you intend to use the evaluation feature in Analytics, you do not need to use the value reported by Number of Tolerable Errors. Instead, you use the Upper error limit frequency calculated by the evaluation feature. For more information, see Evaluating errors in a record sample.
Number of Tolerable Errors provides one way of evaluating deviation in a population.
If you use this method, you know in advance the threshold value reported by Analytics, before you begin audit procedures on the sampled data. If cumulative errors you observe in the course of performing the procedures exceed the Analytics reported value, you know at that point that the deviation rate from a prescribed control is unacceptably high.
After performing your control tests on the sampled data you can compare the number of errors or deviations you found to the Number of Tolerable Errors. If the number of observed errors is less than or equal to the Number of Tolerable Errors you can consider the control is effective, for your specified confidence level.
Statistical validity of sample sizes generated by Analytics
Analytics generates statistically valid sample sizes for most analyses. Exceptions may apply in the following situations:
- You are sampling data sets of less than 1000 records.
- Your organization has in-house sampling experts who can define sample sizes precisely tailored to your needs.
- Your organization has mandated the use of another sampling tool or methodology.
Poisson distribution versus binomial distribution
Two commonly used methods of generating sample sizes are the Poisson and the binomial distributions. Analytics generates sample sizes using the Poisson distribution.
For typical data sets of a thousand or more records, the Poisson and the binomial distributions generate nearly identical sample sizes. For populations of under a thousand records, sample sizes determined with the Poisson distribution tend to be slightly larger and therefore more conservative than sizes determined with the binomial distribution. The binomial distribution adjusts the sample size downward for small populations but the Poisson distribution does not. With very small populations, the sample size generated by the Poisson distribution can actually exceed the population size.
When calculating sample sizes in Analytics, recognize that for record sampling of small data sets, the sample size may be larger than you need. This larger sample size does not present an obstacle to analysis because it is common practice to manually oversample small populations.