Evaluating errors in a record sample
After you have performed your audit procedures on the set of sampled data you can use Analytics to:
- project any errors you found to the entire population
- calculate an upper limit on the deviation rate
Even if you found no errors, you still use the evaluation feature to calculate the basic allowance for sampling risk.
Note
Evaluating errors requires input of some of the values previously generated by calculating sample size.
How evaluation and comparison work
When you evaluate, Analytics uses a statistical formula to project the errors you found in the sample to the entire population, and calculates the Upper error limit frequency (computed upper deviation rate).
You compare the calculated value to the Upper Error Limit (%) that you decided upon earlier when you calculated sample size. Based on the comparison, you decide if a prescribed control is operating effectively.
| Comparison | Conclusion |
|---|---|
| Upper error limit frequency is less than or equal to Upper Error Limit (%) | The prescribed control is operating effectively |
| Upper error limit frequency is greater than Upper Error Limit (%) | The prescribed control is not operating effectively |
Steps
Note
Do not include the thousands separator, or the percentage sign, when you specify values. These characters prevent the command from running, or cause errors.
-
Select Sampling > Record/Monetary Unit Sampling > Evaluate.
Note
The menu option is disabled if a table is not open.
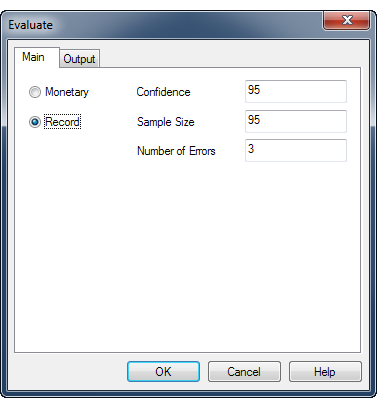
- On the Main tab, select Record.
- Enter the input values to use for evaluating errors:
- Confidence
- Sample Size
Note
Enter the actual sample size as drawn, which might differ from the sample size initially calculated by Analytics.
- Number of Errors
Note
The input values are explained in detail below.
- On the Output tab:
- In the To panel, select one of the following:
- Screen displays the results in the Analytics display area
- File saves or appends the results to a text file
The file is saved outside Analytics.
- If you selected File as the output type, do one of the following:
- Enter a file name in the Name text box.
- Click Name and enter the file name, or select an existing file in the Save or Save File As dialog box to overwrite or append to the file.
If Analytics prefills a file name, you can accept the prefilled name, or change it.
You can also specify an absolute or relative file path, or navigate to a different folder, to save or append the file in a location other than the project location. For example: C:\Results\Output.txt or Results\Output.txt.
Note
ASCII Text File or Unicode Text file (depending on which edition of Analytics you are using) is the only option for File Type.
- In the To panel, select one of the following:
- Click OK.
- If the overwrite prompt appears, select the appropriate option.
Evaluate dialog box inputs
The table below provides detailed information about the input values in the Evaluate dialog box.
Main tab – input values
| Input values – Evaluate dialog box | Description |
|---|---|
| Confidence |
The same confidence level that you entered when you calculated the sample size. For more information, see Calculating sample size for a record sample. |
| Sample Size |
The number of records in the sample. Note Sample Size is the actual sample size as drawn, which might differ from the sample size initially calculated by Analytics. |
|
Number of Errors |
The total number of errors, or deviations, that you found in the sample. |
The figure below shows an example of input values for evaluating errors in a record sample.
Result
Evaluating the errors you found in a record sample produces the following result:
| Input value | Description |
|---|---|
|
Upper error limit frequency (computed upper deviation rate) |
An adjusted deviation rate that Analytics calculates is not exceeded in the entire data set, for the confidence level you specified. |
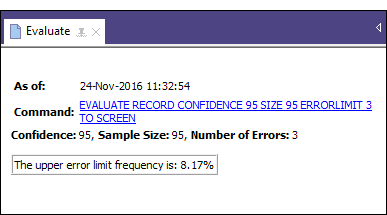
The figure below shows the result of evaluating errors found in a record sample.
What “Upper error limit frequency” tells you
The Upper error limit frequency, when compared to the Upper Error Limit (%) that you decided upon when you calculated the sample size, tells you:
- Whether the control you are examining is operating effectively
- If the control is operating effectively, how effectively it is operating
Example
You evaluate the errors you found in a record sample and Analytics returns an Upper error limit frequency of 4.35%. This percentage is less than the Upper Error Limit (%) (tolerable deviation rate) of 5% that you specified earlier when you calculated the sample size, and specified a confidence level of 95%.
Based on this information, you can make the following statement:
There is a 95% probability that the actual deviation rate from the prescribed control in the entire population does not exceed 4.35%.
If the Upper error limit frequency is greater than 5%, as it is in the figure above, the prescribed control is probably not operating effectively. You need to decide upon further appropriate steps to meet your audit objective.