This getting started tutorial introduces you to the end-to-end process of analyzing data using Analytics.
| Estimated time | 60 minutes |
|---|---|
| Requirements | No previous Analytics experience is required. Some basic data analysis experience is assumed, but not absolutely critical. |
| Analytics version | 13.0 or later (Unicode edition) |
| Do the right version of the tutorial |
Do this version of the tutorial if you're using the Unicode edition of Analytics. If you're using the non-Unicode edition, do Getting started with Analytics (non-Unicode edition). |
Tip
To find out which edition of Analytics you're using, on the Analytics main menu, click Help > About to open the Analytics dialog box. The edition designation appears after the version number.
Note
The Chinese and Japanese user interfaces are Unicode-only.
Scenario
Review corporate credit card transactions
You're asked to review corporate credit card transactions from a two-month period. Your goal is to get a general picture of how employees used cards during the period, and also to identify any possible misuse of cards.
The transaction data is contained in three separate Excel worksheets. Before you can analyze the data, you need to import it into Analytics, and combine the separate data sets into a single Analytics table.
After you've analyzed the data, you want to present the results of your analysis visually, to better engage your audience.
Optional section
You're told that from now on, reviewing corporate credit card transactions will be a recurring responsibility.
To allow yourself, or someone else, to perform future reviews quickly and accurately, you decide to create a script to automate some of the work.
PIPAR – the data analysis cycle in Analytics
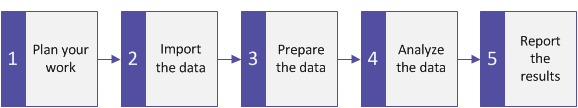
The data analysis cycle in Analytics contains five stages, which are summarized by the acronym PIPAR:
Plan, Import, Prepare, Analyze, Report
Plan your work
Planning your data analysis work is important, and often critical. If you skip the planning stage, and jump straight into running analytical commands against data, you may run into problems, create extra work for yourself, or even miss important analytical insights.
Even a basic plan is better than no plan. With experience, and increasing knowledge of Analytics, your planning will become more fully developed and more precise. Good planning is the key to data analysis projects that progress smoothly and efficiently.
Planning guidelines
What is the intended end product of your analysis?
You need clearly defined objectives in order to be able to plan how to achieve them. For example, in this tutorial, your specific objectives are:
- identify the count, and total amount, of corporate credit card transactions in each merchant category
- identify any transactions in prohibited categories
How will you achieve your objectives?
Accomplishing an objective often requires more than one step, so map a detailed, step-by-step approach to guide you along the way.
For example, two of the steps in the planning for this tutorial could be:
- combine all the individual transaction files into a single file
- group the combined transaction data into merchant categories
Once you've broken down the larger objectives into individual steps, you can consider which Analytics features and functions to use to perform each step.
What data do you need to achieve your objectives?
Itemize the required source data to the level of specific data elements or fields. You won't be able to achieve your desired output without the appropriate input.
In this tutorial you have the main transaction files, but to achieve your second objective you'll also need a list of prohibited merchant category codes.
Are there any technical considerations you must take into account?
Regardless of which tool you're using for data analysis, you must work within its constraints. Is the source data stored in a location or a system that the tool can access, and in a format that it can read? Is the analysis you're proposing supported by the tool?
For example, in order to combine multiple tables in Analytics, the data types of the corresponding fields in each table must be the same. Analytics supports changing the data type of a field, but that's a step you need to account for in your planning.
You may need to adjust your plan as you go along.
In the course of your analysis, you discover something unexpected that warrants further investigation. You realize you need additional data and additional analytical steps.
Your plan can evolve as your understanding of the data evolves. And it can serve as the basis for a more mature plan for future analysis of a similar nature.
Import data
You must import data into Analytics before you can analyze it.
We'll familiarize with the import process by using the Data Definition Wizard to import three Excel worksheets. Importing from Excel is one of the most common methods for acquiring data for analysis in Analytics. However, Analytics supports importing data from a wide variety of data sources.
Open Analytics and "Sample Project.ACL"
Note
The steps below assume you have already activated Analytics.
- Double-click the ACL for Windows shortcut on your desktop.
- In the ACL for Windows screen, under Open, click Analytic Project.
- Navigate to C:\Users\user_account_name\Documents\ACL Data\Sample Data Files and double-click Sample Project.ACL.
Sample Project.ACL opens in Analytics.
If you did not install the Sample Data Files folder in the default location when you installed Analytics, navigate to the location where you installed it.
Import the first two Excel worksheets
You will get started by importing two Excel worksheets at the same time. Importing multiple Excel worksheets simultaneously is a great way to reduce labor.
- From the Analytics main menu, select Import > File.
- In the Select File to Define dialog box,
locate and select Trans_May.xls and click Open.
The Excel file is in the same folder as Sample Project.ACL.
- In the File Format page, make sure the Excel file option is selected and click Next.
- In the Data Source page, select both worksheets in the file:
- Trans1_May$
- Trans2_May$
- Make sure Use first row as Field Names is selected, click Next, and then click Finish.
The two Excel worksheets are imported into two separate Analytics tables.
Import the third Excel worksheet
Now import the third Excel worksheet by itself. When you import a single worksheet, you have the option of manually adjusting some of the metadata settings during the import process, rather than doing it later in Analytics.
- Repeat the steps in the previous procedure to locate and select Trans_April.xls.
- In the File Format page, make sure the Excel file option is selected and click Next.
- In the Data Source page, select Trans_Apr$.
- Make sure Use first row as Field Names is selected, and click Next.
- In the Excel Import page, click the header to select the TRANS_DATE column and make the following changes:
- In the Name field, change TRANS_DATE to DATE.
- In the Length field, change 19 to 10.
Note
You're making adjustments to a data field in the Data Definition Wizard, during the import process. You can also make adjustments later, after you have completed importing the data. You'll see the reason for the adjustments in the next section of the tutorial.
- Click Next, in the File name field type Trans_Apr, and click Save.
- Click Finish, and then click OK.
The third Excel worksheet is imported into an Analytics table.
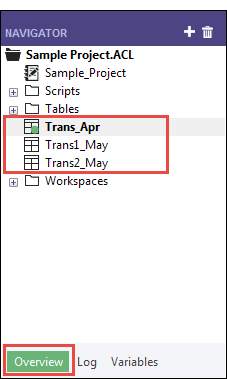
You should now have three new Analytics tables in the Overview tab of the Navigator. These tables contain read-only copies of the Excel data. They do not contain the Excel source data itself.
Prepare data
Often you must perform one or more data preparation tasks before data is ready to analyze.
For this tutorial, you'll perform two preparation tasks:
- make additional adjustments to harmonize data fields
- combine the three new Analytics tables into a single table for analysis
As well, as a best practice, you should always verify the validity of imported data before performing analytical work. Even a small amount of invalid data in a table can invalidate all your subsequent data analysis.
Why do I need to prepare data?
You're eager to get on with the analysis of the data, but without proper data preparation you may not be able to perform the analysis. Or the analysis you perform may be flawed.
A wide variety of issues can affect source data making it unsuitable for analysis without some initial preparation.
For example:
- The source data is spread between several different files and needs to be consolidated so that it can be analyzed as a single set of data.
- Corresponding fields in different files need to be "harmonized", which means making them identical in structure and format as a prerequisite to processing them.
- "Dirty data" needs to be cleansed and standardized, which you can do with Analytics functions.
Key point
The time you spend importing and preparing data may exceed the time you spend on the actual analysis. However, they are critical initial stages, and provide the foundation that your analysis is built on.
Adjust the table layouts
Every table in an Analytics project has a table layout. The table layout contains metadata such as field names, the start position of fields, the length of fields, the data type of fields, and so on.
Before we can combine the three new Analytics tables into a single table, we need to harmonize some of the metadata in the table layouts.
Here's what the Trans_Apr table layout looks like. You'll quickly learn your way around table layouts as you become more familiar with Analytics. You can do a lot of useful things in the table layout.
![]()
Adjust the Trans_Apr table layout
First, you need to change the data type of two fields in the Trans_Apr table.
- Open the Trans_Apr table, if it is not already open.
To open a table, double-click it in the Navigator.
- Above the table view, click Edit Table Layout
 .
. - Double-click the CARDNUM field to open the field definition for editing.
- Under Valid Data Types, double-click UNICODE to update the data type of the field.
In the other two tables, the CARDNUM field has an UNICODE data type. For the most part, combining data requires that corresponding fields in the tables being combined have the same data type.
- Click Accept Entry
 .
.If a prompt appears, click Yes to save your changes.
- Double-click the CODES field and change the data type to UNICODE.
- Click Accept Entry , and then click Close
 to exit the Table Layout dialog box.
Adjust the Trans_May table layouts
To finish the adjustments, you need to change the data type of two fields in both the Trans1_May and the Trans2_May layouts. You may also need to make an adjustment to the DATE field.
Follow the process above to make the following changes in both the Trans1_May and the Trans2_May layouts:
| Field | Change data type to: | Additional change |
|---|---|---|
| CODES | UNICODE | |
| AMOUNT | Enter 2 in the Dec. field to specify that numeric values display two decimal places. | |
| DATE | no change |
Note If the DATE field already has a length of 20, no adjustment is required.
|
When you're finished, the May table layouts should look like the layout below.
Note
The date format (YYYY-MM-DD) isn't shown in the layout summary. The DESCRIPTION field length is different in the two May layouts.
![]()
Verify the imported data
Now let's verify the data in the three imported tables to make sure it's safe to proceed with additional data preparation, and data analysis.
Note
We're verifying the data after updating the data types. When you verify data in Analytics, you're checking that all the values in a field conform to the requirements of the field's data type. So it makes sense to verify data only once the data types are finalized.
- Open the Trans_Apr table.
- From the Analytics main menu, select Data > Verify.
- In the Verify dialog box, select all the fields in the field list.
Tip
Use Shift+click to select multiple adjacent fields.
- Click OK.
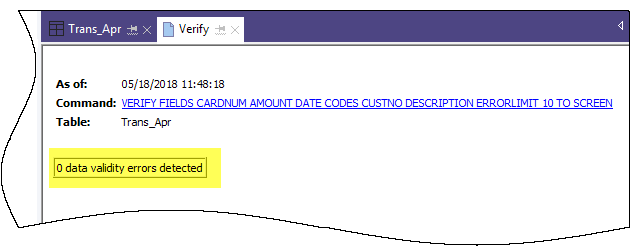
The result should be: 0 data validity errors detected.
Learn more
Did you notice that Analytics automatically translated the action you performed in the user interface into the ACLScript VERIFY command? Every command-level action you perform in the user interface is automatically translated into its corresponding ACLScript command, and captured and stored in the command log that accompanies each Analytics project.
This automatic generation of valid, runnable script syntax is one of the most powerful features in Analytics. We'll be looking at scripting in an optional section at the end of the tutorial.
- In the Navigator, double-click the Trans1_May table to open it, and repeat the steps to verify the data.
- Do the same for the Trans2_May table.
Both tables should not contain any data validity errors.
Note
If you get an error message stating Maximum error limit reached, check that you correctly changed the format of the Date field in the table layout to YYYY-MM-DD.
Learn more
If you want to see what happens when Analytics does identify data validity errors, open Tables\Badfile and run the verification process.
Combine the three Analytics tables
For the final data preparation task, you combine the three new Analytics tables into a single table.
For simplicity, the tutorial combines only three tables. However, you could use the same process to combine 12 monthly tables into a single annual table and perform analysis on data for an entire fiscal year.
- From the Analytics main menu, select Data > Append.
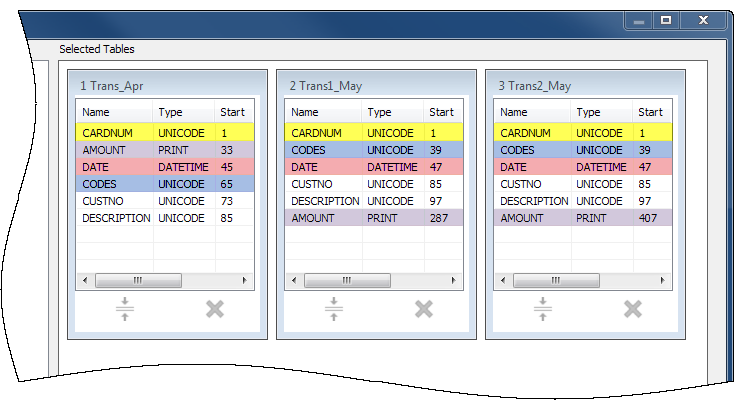
- Under Available Tables, double-click each of the new tables to add it to the Selected Tables area.
- Take a look at the fields in the three tables and notice how the names and data types are identical based on the changes you made in the Data Definition Wizard and the Table Layout dialog box.
To append corresponding fields, their names must be identical, and in most situations their data types must be identical.
- Select Use Output Table so that the output table with the combined data opens automatically after you run the command.
- In the To field, type Trans_All and click OK.
- Click Yes in the notification that pops up.
Note
Don't worry about the notification. The append command performs some automatic harmonization of numeric fields, which saves you time and effort.
The new Trans_All table is created, and contains all the records from the three input tables. The record count in the status bar at the bottom of the Analytics interface should say Records: 481.
You're now ready to move on to some actual data analysis.
Analyze data
You perform analysis in Analytics by using commands and other tools to gain general insights about the data you are investigating, and to answer specific questions.
Note
The analysis stage is where the strength of your earlier planning becomes apparent. If you've formulated clear objectives regarding your investigation, you'll have a clearer idea of the types of analysis to perform.
The data analysis
For this tutorial, you'll perform the following analysis of the data in the Trans_All table:
- group the credit card transaction records by merchant category code in order to discover:
- how employees are using corporate credit cards
- how much money is being spent in each category
- create a filter to isolate any prohibited transactions
Group credit card transactions by merchant category code
Grouping or summarizing a set of data is an excellent way of quickly getting an overview of the data.
- Open the Trans_All table, if it is not already open.
- From the Analytics main menu, select Analyze > Summarize.
- In the Summarize dialog box, select the following fields and options:
Tab Field or option Select or type Main Summarize On select CODES Other Fields select DESCRIPTION Subtotal Fields select AMOUNT Avg, min, max select the checkbox Output To select File Name type Trans_All_Grouped - Click OK.
The new Trans_All_Grouped table is created. The table contains 110 records, one for each unique merchant category code in the Trans_All table. The COUNT field tells you how many source records are in each group.
Tip
Right-click the table view and select Resize All Columns to make the view more compact.
Simple tools for investigation
Now that you have a summarized version of the data, you can use some basic Analytics tools to gain general insight into corporate credit card use.
You can learn a lot about patterns of use, and possible misuse, in just a few clicks.
| To gain this insight: | Do this in the Trans_All_Grouped table: |
|---|---|
| What was the total amount charged by employees during April and May? |
Total expenditure was $187,177.13. |
| Where did employees spend the most money? |
The Description field shows you that the most money was spent on:
|
| What were the largest single expenditures? |
The Description and Maximum AMOUNT fields show you that the largest single expenditure was a Club Med amount of $1999.06. Is Club Med an authorized merchant code for the corporate credit card? If the credit card limit is $2000, was an employee charging an amount just under the limit? |
| What does an examination of infrequently used codes reveal? |
Five categories had only a single charge each. Are some of them prohibited categories? Perhaps one or more employees thought that misusing a company card only very occasionally would allow them to escape detection.
|
| Are any of the categories prohibited? |
Perhaps one or more of these categories are prohibited?
Note Manual scanning is impractical for all but small data sets. We'll look at a more practical, more reliable method next. |
Learn more
Perhaps you just want to perform some quick analysis and you don't want to output the results to a new table. When you summarized the Trans_All table, instead of selecting File in the Summarize dialog box, you could select Screen, and output the results to the Analytics display area.
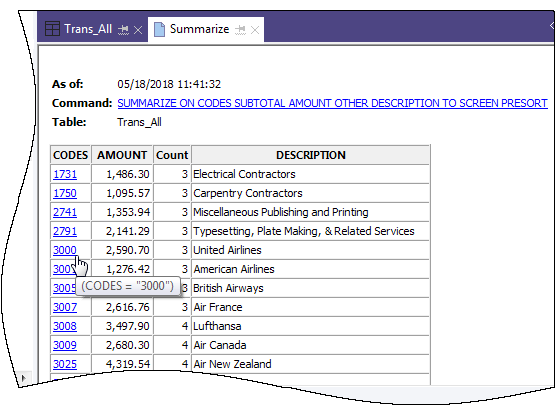
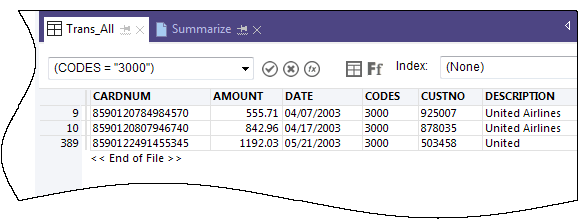
Outputting to screen is only practical for smaller data sets. However, it has the advantage of providing an easy way to drill-down on individual groups and see only the source records in each group.
Create a filter to isolate prohibited transactions
Filters allow you to isolate just the records you are interested in at a particular moment. Filters are a powerful tool for answering specific questions about data.
A general review of the corporate credit card transactions alerted you to some possible prohibited transactions. You decide to confirm whether any transactions are prohibited by matching a list of prohibited merchant category codes against the data.
Create the filter expression
- Open the Trans_All table.
- Click Edit View Filter
 at the top of the table view to open the Expression Builder.
The Expression Builder is an Analytics component that lets you use the mouse to create expressions, rather than typing expression syntax manually. Expressions are combinations of values and operators that perform a calculation and return a result.
- In the Functions drop-down list, select Logical, and then double-click the MATCH function to add it to the Expression text box.
You're going to use MATCH to isolate several prohibited merchant category codes in the CODES field.
- In the Expression text box, highlight the comparison_value placeholder, and then in the Available Fields list, double-click CODES.
The CODES field replaces comparison_value.
- Copy the string of prohibited codes below and use them to replace the test1 , test2 <,test3...> placeholder:
"5094", "5993", "7273", "7295", "7297", "7994", "7995", "7996", "8641"
Note
Make sure you copy the entire string, including all quotation marks.
Your expression should look like this:
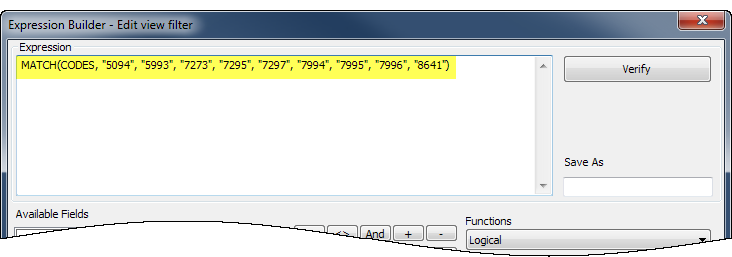
Verify the expression and save and apply the filter
- Click Verify to test that the syntax of your expression is valid.
Verifying expressions as soon as you create them is a best practice because it can help avoid more time-consuming troubleshooting later.
If you get an error message, double-check that the syntax of the expression exactly matches the syntax shown above.
- In the Save As field, type or copy the filter name f_Prohibited_codes.
Galvanize recommends that you preface the names of saved filters with f_
- Click OK.
The f_Prohibited_codes filter is applied to the Trans_All table. Transactions that use a prohibited merchant category code are now isolated and plain to see. Consider a table with tens of thousands of records, or more, and the value of filters quickly becomes apparent.
Remove or reapply the filter
Try removing and reapplying the filter:
- To remove the filter, click Remove Filter
 .
. - To reapply the filter, do either of the following:
- Select the filter name from the Filter history drop-down list at the top of the view.
- Click Edit View Filter to open the Expression Builder, double-click the filter name in the Filters list, and click OK.
Tip
The Filter history list holds a maximum of 10 filters, so at times you may need to use the Expression Builder method for reapplying a saved filter.
Learn more
Beyond filters
Filters work well if the number of criteria or conditions contained by the filter are manageable. The filter you created in this tutorial contains only 9 codes. But what if your list of prohibited merchant category codes was several dozen, or more?
A more efficient approach would be to join an Analytics table containing the prohibited codes with the transactions table. Every match in the joined output table would be a prohibited transaction.
Joins are beyond the scope of this tutorial, but they are a frequently used feature in Analytics.
Report results
Once your data analysis is complete, Analytics gives you several different ways to report or present your results.
Traditional reports with columns of data are available, but we'll look at conveying results using the more engaging data visualization described below.
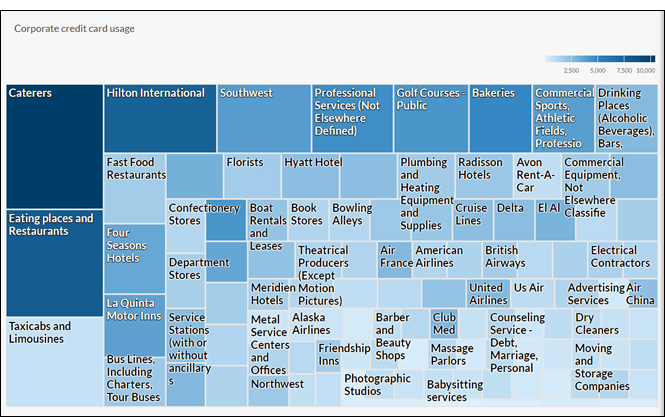
Treemap visualization
This treemap visualization shows the grouped credit card transactions you output in the Trans_All_Grouped table. The relation between groups is conveyed in two different ways:
- size of the box indicates the count of individual transactions in each group
The larger the box, the greater the number of transactions. The boxes are arranged in size from top left to bottom right.
- color intensity of the box indicates the total amount of each group
The darker the box, the greater the total amount.
So, for example, the size of the Club Med box, in the bottom right quadrant, indicates only a small number of transactions, but the color indicates that the total transaction amount is significant.
First, a little pre-work
You're going to create the treemap visualization in Results, the issue remediation app in the cloud-based HighBond platform. Access to a lite version of Results is included in your ACL Robotics subscription.
In order to create the visualization, you must first create a simple, two-level data container to hold it. The first level is called a Collection, and the second level is called an Analysis. They're quick and easy to create.
Sign in to Launchpad and access Results
Note
If for some reason you cannot sign in to Launchpad or access Results, you can use one of the alternative report creation methods listed in Other reporting methods in Analytics.
- Go to Launchpad (www.highbond.com).
- Enter your HighBond account credentials (e-mail and password) and click Sign In.
Launchpad opens.
- Click Results.
The Results homepage opens.
Note
If you cannot access Results, you may not be assigned an appropriate subscription type or Results role. Use one of the alternative report creation methods listed in Other reporting methods in Analytics.
If you would like to access Results, contact your company’s Analytics account administrator.
Create a Collection
- From the Results homepage, click New Collection.
- On the New Collection page, in the Name field, enter or copy ACL Tutorial.
- At the bottom of the page, click Create Collection.
The Collection settings page opens.
Create an Analysis
- At the bottom of the Collection settings page, under What's Next?, click create your first Data Analysis.
The Analysis Details page opens.
- On the Analysis Details page, in the Name field, enter or copy Sample Report.
- Click Create Analysis.
The new ACL Tutorial Collection opens with the empty Sample Report Analysis that you just created.
Note
Leave Results open. You will be coming back to create the data visualization.
Export data from Analytics to Results
The next stage is to export the Trans_All_Grouped table from Analytics to Results.
- In Analytics, open the Trans_All_Grouped table.
- From the Analytics main menu, select Data > Export.
- In the Export dialog box, select the following options:
Tab Option Select Main View select View Export As select HighBond - Click To, and in the Select Destination Test dialog box navigate to the Sample Report Analysis container you just created and double-click to open it.
- In the New data analytic field enter or copy Trans_All_Grouped and click Create.
You are returned to the Export dialog box and an ID number and data center code are prefilled in the To text box.
- Click OK.
The data in the Trans_All_Grouped table is exported to Results.
Create the visualization
Now you're ready to create the visualization in Results.
- Return to the ACL Tutorial collection in Results and press F5 to refresh the browser window.
The Trans_All_Grouped table appears.
- Under Remediate, click View Records.
The Table View opens and displays the records.
- Click Add Visualization and click the Treemap visualization.
- In the Configure Visualization panel, select the fields and options shown below.
Note
If you can't see the Configure Visualization panel, click Configure
 .
.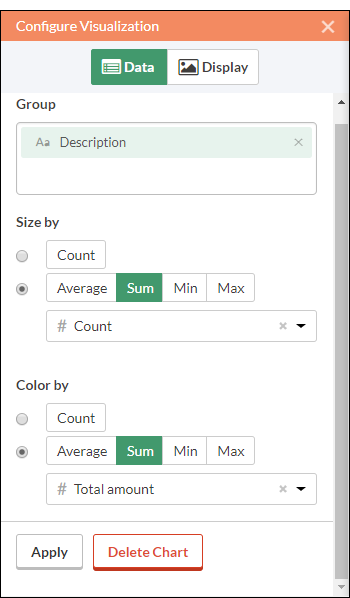
- Click Apply.
The Treemap visualization is generated.
You can hover your mouse over the individual boxes in the treemap to see the embedded data.
If you change the size of the browser window, the treemap dynamically updates by repositioning boxes, and by displaying and suppressing a different selection of associated descriptions.
Save the visualization
If you want to keep any visualizations you create you need to save them. You need to save each visualization individually, and also the container that holds them, called an interpretation.
- Click Untitled at the top left corner of the Treemap visualization and type a title for the visualization such as Transaction Treemap and press Enter.
- Click Save > Save As .
- In the Title field, type a name for the interpretation such as Tutorial visualizations and click Save.
The interpretation and the visualization are both saved and can be reopened later.
- Click the name of the collection, ACL Tutorial, in title bar to return to the Sample Report Analysis container.
-
Click the number in the Interpretations column. The Interpretations dialog box appears and notice that it lists the newly created interpretation, Tutorial visualizations.
You can create multiple visualizations and interpretations in each Analysis container. Each visualization is based on the data in the Table View.
Publish to Storyboards
Create a storyboard to display the visualization you just created. A storyboard is a communication platform that displays multiple visualizations and rich text content in a single presentation.
- Open the Storyboards app.
- Click Add Storyboard.
- Enter a descriptive title for your storyboard. Storyboard titles can be a maximum of 80 characters.
- Click Add
 and select Add Chart
- Select one of the following options:
- To display table view from the interpretation, select the parent table entry
 , Tutorial visualizations.
 - To display visualization from the interpretation, select the child chart entry
 , Transaction Treemap.
You can enter a keyword or phrase into the search field to filter the list of available visualizations.
- To display table view from the interpretation, select the parent table entry
- In the top right-hand corner, click Save > Save.
Other reporting methods in Analytics
In addition to the data visualizations available in Results, Analytics has several other methods you can use for reporting the results of your data analysis:
| Reporting method | Description |
|---|---|
| Data visualizations in the Analysis App window |
The data visualization capability in Results is also available locally in the Analysis App window, a freestanding component of Analytics. Note Some of the charts and visualizations available in Results may not be available in the Analysis App window until a new version of Analytics is released. For more information, see Interpretations and visualizations. |
| Legacy Analytics charts |
Analytics contains a legacy charting and graphing capability that allows you to create basic visual reports. For more information, see Working with Analytics graphs. |
| Traditional columnar reports |
In some cases, a traditional text- and number-based report with rows and columns of data is all you need. For more information, see Formatting and generating Analytics reports. |
| Third-party reporting tool |
You can use a third-party reporting tool such as Tableau or Microsoft BI and import data directly from Analytics. For more information, see Connecting to Analytics from a third-party reporting application. |
| Exporting data to Excel or CSV |
You can export data to Excel, or to a comma-separated file, and use the reporting capabilities of Excel, or of any tool that can work with a CSV file. For more information, see Exporting data. |
You're finished
Congratulations! You've completed your end-to-end introduction to analyzing data using Analytics.
Where to next?
You have several options for continuing to learn about Analytics:
| Academy |
Academy offers a range of courses for various experience levels. ACL Analytics Foundations Program is a series of six mini-courses that teaches Analytics basics for new users. Academy is the Galvanize online training resource center. Go to the course catalog to see the available courses. Academy courses are included at no extra cost for any user with a subscription. |
|---|---|
| Analytics and ACLScript Help |
You're currently in the Analytics and ACLScript Help. The Help provides reference-style conceptual material, step-by-step instructions, and ACLScript syntax for all aspects of Analytics. For example, here are the Help topics for the append operation, which formed part of the tutorial you just completed:
|
| Community |
Community is a web-based platform with a variety of customer resources, including a customer forum where experienced Analytics users share their expertise and answer questions. The customer forum is the best place to learn about the real-world usage and application of Analytics. |
Script your work (optional section)
| Estimated time | 20 minutes |
|---|---|
| Requirements | No previous scripting experience is required. |
| Analytics version | 13.0 or later (Unicode edition) |
You can gain a lot of value using Analytics in an ad hoc or manual fashion without ever writing a script. For the most part, anything that can be done in a script can be done in the user interface, and vice versa. However, to gain the most value, power, and efficiency from Analytics, you need to script.
The good news is that Analytics provides tools to make scripting relatively easy, even for a novice.
The case for scripting
Imagine that in addition to all your current responsibilities you're now responsible for reviewing corporate credit card usage on a regular basis.
Save time
The basic review process is standardized. With each review cycle, you can spend time repeating the basic process manually, or you can save time by automating the process.
Delegate with confidence
If the process is automated, maybe you can delegate the task to a more junior staff member. A tested script gives you the confidence that less experienced employees can perform the task consistently and accurately, without a significant increase to their workload.
What is a script?
An Analytics script is a series of ACLScript commands that perform a particular task, or several related tasks. For example, everything that you just did manually in the first part of this tutorial could also be performed using a script.
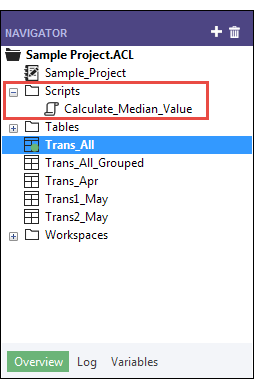
ACLScript is the command language that forms the basis of Analytics. Scripts are stored in Analytics projects. Individual scripts appear in the Navigator, and are prefaced by the script icon ![]() .
.
How the Analytics command log works
You may have noticed that the Navigator contains the Log tab. As a script writer, you'll discover that the Analytics command log is your best friend.
- Click the Log tab to open it.
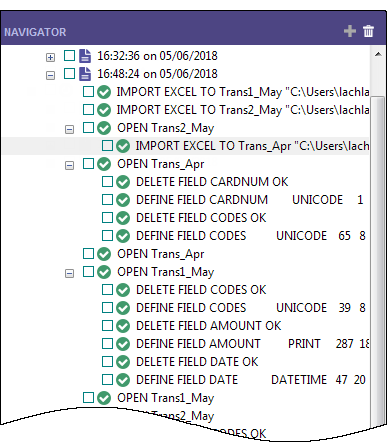
You're looking at the Analytics command log. You can drag the Navigator panel wider to see more of the content.
The log records the exact sequence of commands executed during each Analytics session, and saves them as part of the Analytics project.
If you've just finished the first part of this tutorial, the log contains a list of all the actions you've just performed in the user interface.
- In the log, locate and click the SUMMARIZE command that outputs results to a new table.

The command prefills the Command Line near the top of the Analytics interface, just below the toolbar.
Note
If the Command Line isn't visible, select Window > Command Line from the Analytics main menu.
- Open the Trans_All table, if it is not already open.
- If the f_Prohibited_codes filter is applied, remove it.
- Click in the Command Line, change "Trans_All_Grouped.FIL" to "Trans_All_Grouped_2.FIL", and press Enter.
The Summarize command is re-run on the Trans_All table and outputs the Trans_All_Grouped_2 table, which replicates the first output table you created manually.
With a minimal amount of effort you re-performed all your earlier manual work required to summarize the Trans_All table. Running a command from the command line is like running a simple one-line script.
Building a script by copying commands from the log
You'll again reuse ACLScript syntax from the log, but this time you'll copy the syntax to an Analytics script. To keep things quick and easy, you'll script only a portion of the work you performed manually in the tutorial, but you could script all of it.
Note
We're going to skip over some scripting best practices in order to keep this introduction to scripting brief. The goal is to demonstrate how easy it is for even new users to create scripts in Analytics.
- In the log, locate and select the following commands:
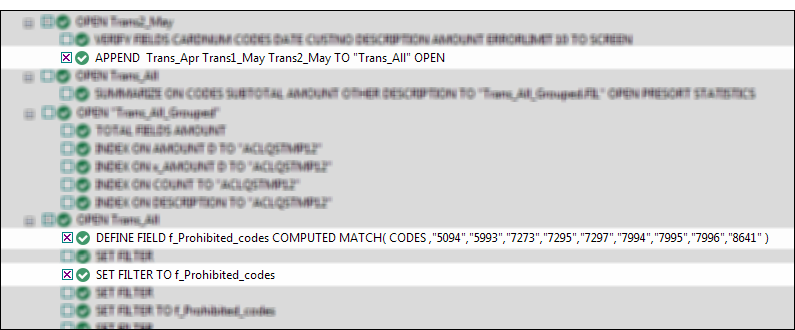
- Right-click the log and select Save Selected Items > Script.
- In the Save Script As dialog box, enter the script name Append_and_filter and click OK.
- In the Overview tab of the Navigator, double-click the newly created Append_and_filter script to open it in the Script Editor.
The script opens and contains the complete syntax of the three commands you selected in the log.
- Take a moment to read the syntax for each command.
Do you see how the actions you previously performed in the user interface correspond to individual pieces of ACLScript syntax? For example, after the APPEND command, there are the names of the three tables you appended:
Trans_Apr Trans1_May Trans2_May
For the most part, the correspondence between ACLScript syntax and actions in the user interface is relatively straightforward, which means the syntax is not that difficult to understand.
- Modify the script by adding _2 in the following locations:
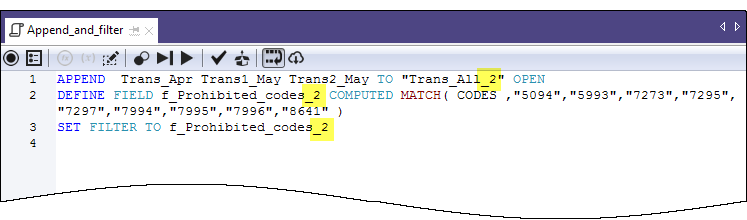
You're adding _2 to avoid name conflicts with the table and filter you already created manually.
- On the Script Editor toolbar click Run
 to run the script.
Click Yes to any prompts that appear.
The script runs and performs the following tasks:
- appends the three tables you imported from Excel into a single table, and opens the new table
- creates the prohibited codes filter
- applies the filter to the new table
As you can see, running a script is much faster than performing the same actions manually. Imagine the time savings, and improved consistency, in a real-world situation with much more complex analysis performed on a weekly or monthly basis.
Note
You can also run a script by right-clicking it in the Navigator and selecting Run. A script does not have to be open to be run.
The entire tutorial in a script
The entire tutorial you just performed manually appears below in a script (in the "Steps" section). To finish this brief introduction to scripting, you're going to copy the script to Analytics and then redo the tutorial work, but this time with just a couple of clicks of the mouse.
Note
The script assumes that the Sample Data Files folder is installed in the default location. If the folder is installed in a different location, you need to modify the navigation paths in the script to point to the correct location.
The tables created by the script are appended with _s so that they don't overwrite the tables you created manually.
Create a new, empty script
- In the Overview tab in the Navigator, right-click the Scripts folder and select New > Script.
- Right-click the New_Script, select Rename, type or copy Getting_Started_tutorial, and press Enter.
Copy and paste the tutorial script
- Click Show me the script below.
- Click and drag to select the entire script and then press Ctrl+C to copy the script.
Note
It's important that you select the entire script and don't miss any lines. Alternately, you can download a text file with the script here: Getting started tutorial (Unicode edition)
- Click in the Script Editor window and press Ctrl+V to paste the script syntax into the empty Getting_Started_tutorial script.
Update and save the script
- Update the navigation paths in the script:
- Click the first line of the script.
- Right-click and select Find.
- Type the following entries in the Replace dialog box:
- Find what: user_account_name
- Replace with: the actual account name on your computer
- Perform the find-and-replace of all instances of user_account_name
- Click Save the Open Project
 , and click Yes in the prompt that appears.
If you do not find the save icon, select Window > Toolbar in the Analytics main menu to enable the toolbar.
Run the script
On the Script Editor toolbar click Run ![]() to run the script.
to run the script.
The script runs and replicates all the tutorial work. Interactive notifications provide key information as the script runs.
Note
If you haven't worked with scripts before, the script syntax may look overwhelming at first. Keep in mind that almost all the syntax was simply copied from the Analytics log.
The syntax for the interactive notifications in the script (DIALOG commands) was auto-generated by another relatively simple Analytics tool.
The green COMMENT commands walk you through the script at a high level. You'll recognize the tasks that you just completed in the preceding tutorial.
COMMENT
*** Unicode Edition ***
This script performs all the actions that you performed manually in the "Getting Started with ACL Analytics" tutorial.
END

COMMENT Allows overwriting of tables without a user confirmation.
SET SAFETY OFF

COMMENT Imports the three Excel worksheets.

IMPORT EXCEL TO Trans1_May_s "C:\Users\user_account_name\Documents\ACL Data\Sample Data Files\Trans1_May_s.fil" FROM "Trans_May.xls" TABLE "Trans1_May$" KEEPTITLE  FIELD "CARDNUM" C WID 19 AS "" FIELD "CODES" N WID 4 DEC 0 AS "" FIELD "DATE" D WID 19 PIC "YYYY-MM-DD hh:mm:ss" AS "" FIELD "CUSTNO" C WID 6 AS "" FIELD "DESCRIPTION" C WID 95 AS "" FIELD "AMOUNT" C WID 9 AS ""

IMPORT EXCEL TO Trans2_May_s "C:\Users\user_account_name\Documents\ACL Data\Sample Data Files\Trans2_May_s.fil" FROM "Trans_May.xls" TABLE "Trans2_May$" KEEPTITLE  FIELD "CARDNUM" C WID 19 AS "" FIELD "CODES" N WID 4 DEC 0 AS "" FIELD "DATE" D WID 19 PIC "YYYY-MM-DD hh:mm:ss" AS "" FIELD "CUSTNO" C WID 6 AS "" FIELD "DESCRIPTION" C WID 155 AS "" FIELD "AMOUNT" C WID 9 AS ""

IMPORT EXCEL TO Trans_Apr_s "C:\Users\user_account_name\Documents\ACL Data\Sample Data Files\Trans_Apr_s.fil" FROM "Trans_April.XLS" TABLE "Trans_Apr$" KEEPTITLE FIELD "CARDNUM" N WID 16 DEC 0 AS "" FIELD "AMOUNT" N WID 6 DEC 2 AS "" FIELD "DATE" D WID 10 PIC "YYYY-MM-DD" AS "" FIELD "CODES" N WID 4 DEC 0 AS "" FIELD "CUSTNO" C WID 6 AS "" FIELD "DESCRIPTION" C WID 45 AS ""

COMMENT Adjusts the table layouts of the three new Analytics tables.

OPEN Trans_Apr_s
DELETE FIELD CARDNUM OK
DEFINE FIELD CARDNUM UNICODE 1 32 WIDTH 35
DELETE FIELD CODES OK
DEFINE FIELD CODES UNICODE 65 8 WIDTH 11

OPEN Trans1_May_s
DELETE FIELD CODES OK
DEFINE FIELD CODES UNICODE 39 8 WIDTH 11
DELETE FIELD AMOUNT OK
DEFINE FIELD AMOUNT PRINT 287 18 2 WIDTH 9
DELETE FIELD DATE OK
DEFINE FIELD DATE DATETIME 47 20 PICTURE "YYYY-MM-DD" WIDTH 27

OPEN Trans2_May_s
DELETE FIELD CODES OK
DEFINE FIELD CODES UNICODE 39 8 WIDTH 11
DELETE FIELD AMOUNT OK
DEFINE FIELD AMOUNT PRINT 407 18 2 WIDTH 9
DELETE FIELD DATE OK
DEFINE FIELD DATE DATETIME 47 20 PICTURE "YYYY-MM-DD" WIDTH 27

COMMENT Verifies the imported data and provides user notifications.

OPEN Trans_Apr_s
VERIFY FIELDS CARDNUM AMOUNT DATE CODES CUSTNO DESCRIPTION ERRORLIMIT 10
IF WRITE1=0 DIALOG (DIALOG TITLE "User Dialog" WIDTH 490 HEIGHT 100 ) (BUTTONSET TITLE "&OK;&Cancel" AT 360 12 DEFAULT 1 ) (TEXT TITLE "Trans_Apr_s table:  0 data validity errors detected" AT 12 28 )
IF WRITE1>0 DIALOG (DIALOG TITLE "User Dialog" WIDTH 490 HEIGHT 100 ) (BUTTONSET TITLE "&OK;&Cancel" AT 360 12 DEFAULT 1 ) (TEXT TITLE "Trans_Apr_s table:  %WRITE1% data validity errors detected" AT 12 28 )

OPEN Trans1_May_s
VERIFY FIELDS CARDNUM CODES DATE CUSTNO DESCRIPTION AMOUNT ERRORLIMIT 10
IF WRITE1=0 DIALOG (DIALOG TITLE "User Dialog" WIDTH 490 HEIGHT 100 ) (BUTTONSET TITLE "&OK;&Cancel" AT 360 12 DEFAULT 1 ) (TEXT TITLE "Trans1_May_s table:  0 data validity errors detected" AT 12 28 )
IF WRITE1>0 DIALOG (DIALOG TITLE "User Dialog" WIDTH 490 HEIGHT 100 ) (BUTTONSET TITLE "&OK;&Cancel" AT 360 12 DEFAULT 1 ) (TEXT TITLE "Trans1_May_s table:  %WRITE1% data validity errors detected" AT 12 28 )

OPEN Trans2_May_s
VERIFY FIELDS CARDNUM CODES DATE CUSTNO DESCRIPTION AMOUNT ERRORLIMIT 10
IF WRITE1=0 DIALOG (DIALOG TITLE "User Dialog" WIDTH 490 HEIGHT 100 ) (BUTTONSET TITLE "&OK;&Cancel" AT 360 12 DEFAULT 1 ) (TEXT TITLE "Trans2_May_s table:  0 data validity errors detected" AT 12 28 )
IF WRITE1>0 DIALOG (DIALOG TITLE "User Dialog" WIDTH 490 HEIGHT 100 ) (BUTTONSET TITLE "&OK;&Cancel" AT 360 12 DEFAULT 1 ) (TEXT TITLE "Trans2_May_s table:  %WRITE1% data validity errors detected" AT 12 28 )

COMMENT Verifies the Badfile table and provides a user notification.
OPEN Badfile
VERIFY FIELDS InvoiceNo Prodno Price OrderQty ShipQty Total ERRORLIMIT 10
IF WRITE1=0 DIALOG (DIALOG TITLE "User Dialog" WIDTH 490 HEIGHT 100 ) (BUTTONSET TITLE "&OK;&Cancel" AT 360 12 DEFAULT 1 ) (TEXT TITLE "Badfile table:  0 data validity errors detected" AT 12 28 )
IF WRITE1>0 DIALOG (DIALOG TITLE "User Dialog" WIDTH 490 HEIGHT 100 ) (BUTTONSET TITLE "&OK;&Cancel" AT 360 12 DEFAULT 1 ) (TEXT TITLE "Badfile table:  %WRITE1% data validity errors detected" AT 12 28 )
CLOSE

COMMENT Appends the three new Analytics tables into a single combined table.
APPEND Trans_Apr_s Trans1_May_s Trans2_May_s TO "Trans_All_s" OPEN
DIALOG (DIALOG TITLE "User Dialog" WIDTH 630 HEIGHT 100 ) (BUTTONSET TITLE "&OK;&Cancel" AT 500 12 DEFAULT 1 ) (TEXT TITLE "The combined transactions table (Trans_All_s) contains %WRITE1% records" AT 12 28 )

COMMENT Groups the combined table by merchant category code.
SUMMARIZE ON CODES SUBTOTAL AMOUNT OTHER DESCRIPTION TO "Trans_All_Grouped_s.FIL" OPEN PRESORT STATISTICS
DIALOG (DIALOG TITLE "User Dialog" WIDTH 700 HEIGHT 100 ) (BUTTONSET TITLE "&OK;&Cancel" AT 570 12 DEFAULT 1 ) (TEXT TITLE "The grouped transactions table (Trans_All_Grouped_s) contains %WRITE1% merchant category codes" AT 12 28 WIDTH 550 )

COMMENT Filters the combined table to show only prohibited transactions.
OPEN Trans_All_s
DEFINE FIELD f_Prohibited_codes COMPUTED MATCH(CODES, "5094", "5993", "7273", "7295", "7297", "7994", "7995", "7996", "8641")
SET FILTER TO f_Prohibited_codes

COMMENT Successful completion message.
DIALOG (DIALOG TITLE "User Dialog" WIDTH 490 HEIGHT 100 ) (BUTTONSET TITLE "&OK;&Cancel" AT 360 12 DEFAULT 1 ) (TEXT TITLE "The script successfully completed" AT 12 28 )

COMMENT A user confirmation is required before overwriting a table.
SET SAFETY ON
You're finished
That's the end of this brief introduction to scripting. We hope you've seen enough to be convinced of the value of scripting and that you want to learn more.
Where to next?
You have several options for learning more about scripting in Analytics:
| Option | Useful information |
|---|---|
| Tutorials |
The Analytics Help contains the following beginner-level tutorials: The Help also contains a complete ACLScript language reference with detailed information about every Analytics command and function. |
| Academy |
Academy offers both an introductory and an advanced scripting course:
Academy is the Galvanize online training resource center. Go to the course catalog to see the available courses. Academy courses are included at no extra cost for any user with an ACL subscription. |
| Community |
Community is a web-based platform with a variety of customer resources, including a customer forum where Analytics scripting is frequently discussed in depth. |