Monitoring and communicating results
The Audit function has a unique position in the organization to deliver assurance and consulting insight across the span of business functions. However, their expert opinion is not valued by executives and business leaders without empirical data evidence as proof. In this article, we discuss how to monitor and communicate results using the Results and Storyboards apps.
This article builds on the examples illustrated in Executing your audit.
What does it mean to monitor and communicate results?
Monitoring and communicating results includes identifying and managing exceptions, gathering information from respondents to contextualize data, and visualizing data to highlight trends, patterns, or outliers.
Where do I monitor and communicate results?
You can monitor and communicate results using the Results and Storyboards apps.
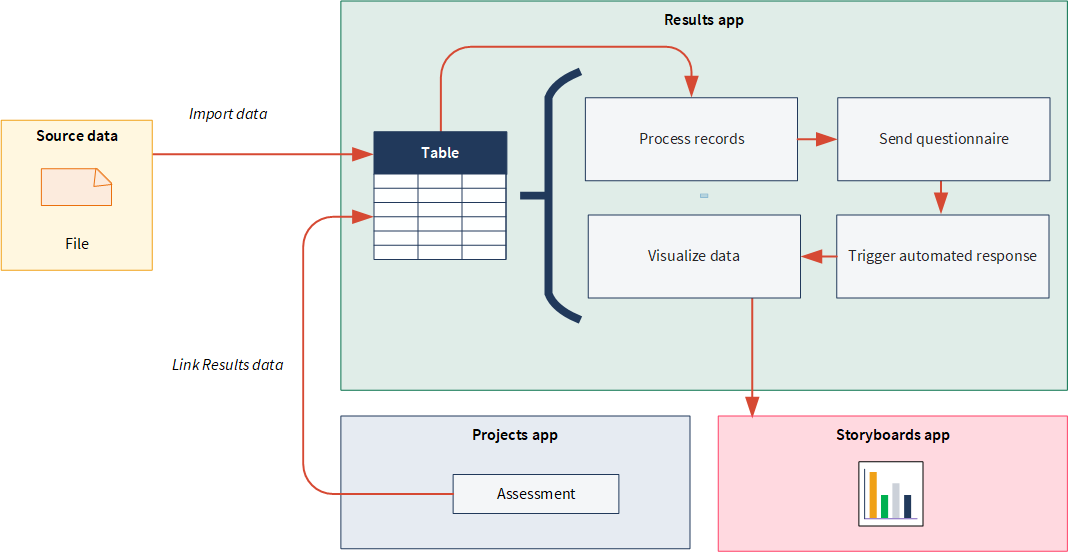
The big picture
- Questionnaires are used to contextualize data and responses are stored in Tables.
- Triggers automate your organization's remediation processes by executing a set of actions based on record data in Tables or metric thresholds you define.
- Storyboards present data results using multiple visualizations, which is based on record data in Tables.
Once you've completed your audit analysis, you can link Results data to your assessments in the Projects app to consolidate information and easily sign-off on when remediation is complete.
Steps
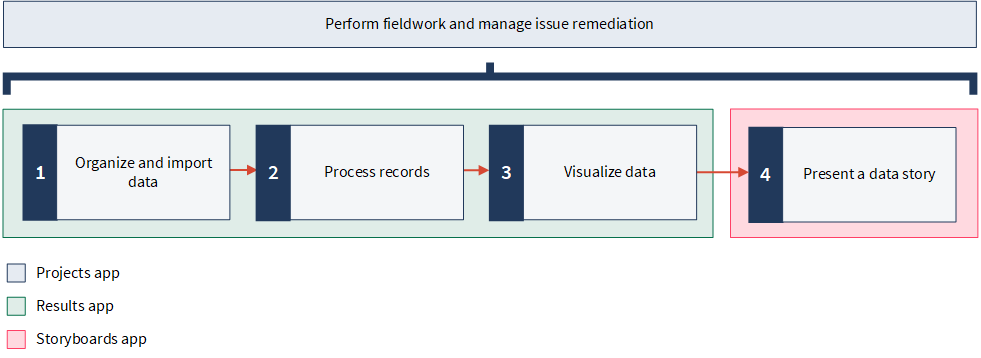
Ready for a tour?
Let's take a closer look at these features in context.
1. Organize and import data
The first step is to set up and organize your data in Results. There are three levels of organization for data: Collections, Analyses, and Tables. Data is stored in a table called a Data Analytic. Each table is contained within an Analysis and a Collection.
Example
Scenario
You are a staff auditor responsible for a physical security audit. You previously carried out some of the fieldwork already in Projects, and are currently working on the following procedure:
3-02: On weekends, only the main entrances of facilities (South 1 in Denver (DV1)) and South 2 in Los Angeles (LA1)) are to permit key card entry.
To identify and follow up on incidents of unauthorized weekend access, you want to analyze and process the access logs using Results.
Your manager has already analyzed the access logs in Analytics and exported the results to Excel for you.
Process
Help topic Setting up Results
You set up the following data containers in Results:
- Collection Latex Facility Security Review
- Analysis Latex Facility Security Review 2015
- Data Analytic Latex Facility Security Review 2015 Q1
Then, you import the Excel file into the Latex Facility Security Review 2015 Q1 data analytic.
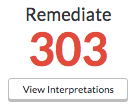
Result
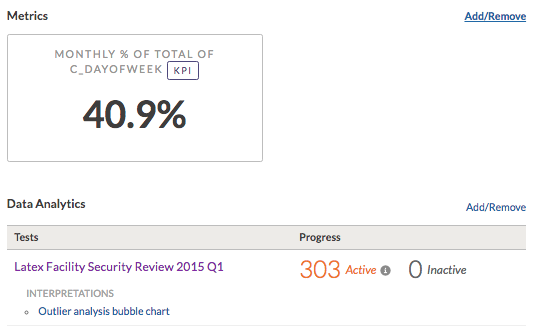
The data is imported and displayed in a table. There are 303 issues where entrances other than the main entrance were used on weekends.
2. Process records
Once records are available, you can process them. Processing a record allows you to provide information about a record, such as the priority, status, and who it is assigned to. You can also add comments and attach files. You can process the records in a data analytic individually, in batches, or all at once.
Tip
Incident data capture can also be automated using event reports. Organizations can efficiently collect whistleblower data to identify unethical behavior, take corrective action, and forecast future risk mitigation efforts.
Update records
From Results, you can manage the entire remediation process. This includes collecting evidence or input to close out your flagged record and resolve cases. All actions are recorded as a defensible evidence trail to support your analysis.
Example
Scenario
You notice that, other than the permitted main entrance, there are six unauthorized access points in use on weekends:
- East 1 (E1)
- East 2 (E2)
- North 1 (N1)
- North 2 (N2)
- West 1 (W1)
- West 2 (W2)
Since the majority of the issues are related to the North 2 entrance, there's a high likelihood of a control failure, such as a broken lock. The West 1 entrance opens directly into the West wing of the facility, which is where the top secret formula is produced. If this formula fell into the hands of competitors, Vandelay Industries would almost certainly be out of business. As the East 1 entrance opens into the back of the administrative wing, its weekend use is less critical.
Process
Help topic Processing records
You process the records as follows:
- West 1 entrance records High priority
- East 1 entrance records Medium priority
- All other records Low priority
All records are assigned to the appropriate person to review. You also adjust the status on all records from New to Open.
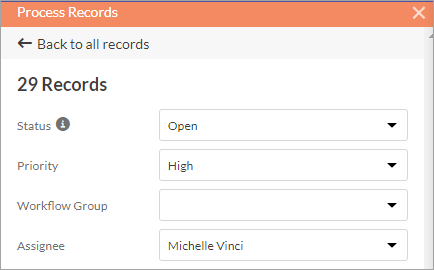
Result
The records are processed.
Automate the remediation workflow
Results helps you automate your organization's remediation workflow when investigating potential issues. Using triggers, you can manage a large number of potential issues, and identify and prioritize those which need immediate attention.
Example
Scenario
You want to be able to set up a remediation workflow that performs a set of actions every time a new record is added to your table. Newly added records should be automatically processed, with the correct priority and status assigned, based on the access point that was used.
Process
Help topic Create a trigger
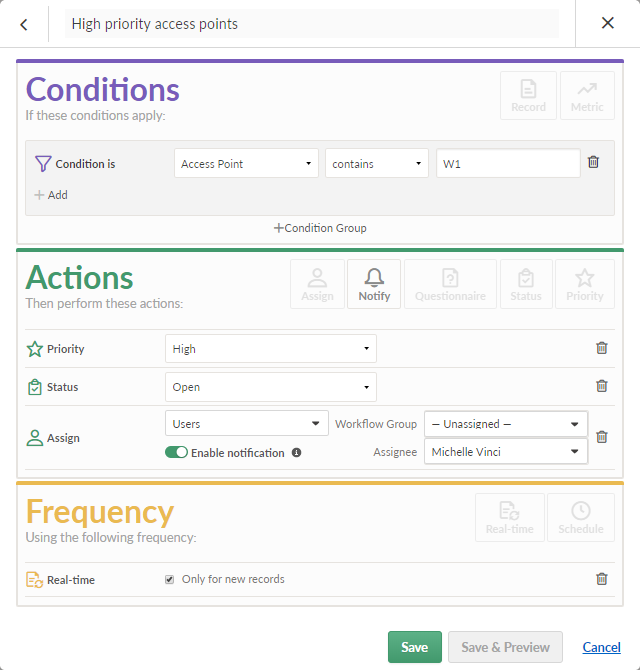
Since you're assigning records three different priorities based on which entrance was used (High for West 1, Medium for East 1, and Low for West 2, East 2, North 1, and North 2), you recognize that you need to create three triggers – one for each priority level.
You create the following triggers:
- High priority access points
- Medium priority access points
- Low priority access points
Result
The trigger notifies the appropriate person, updates the record status, and escalates the priority of the record when the conditions are met. The action is automated and the entire process is managed through Results – with no external systems or bottlenecks to contend with.
Create questionnaires
Questionnaires are used to gather information from respondents and contextualize data. Each collection can have one or more questionnaires that you deploy as follow-up mechanisms when remediating records. Responses are captured in the specified table with each question defined as a distinct column.
Tip
The Template Questionnaires Collection contains a variety of pre-built questionnaires that you copy and use as a starting point. Each template questionnaire relates to different industry segments and is pre-populated with a series of questions.
Example
Scenario
All employees and their managers in the organization are required to complete a Security and Privacy training course that includes the facility access policy.
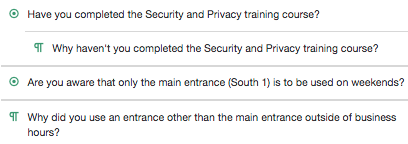
If an employee uses an entrance other than the main entrance on weekends, they should be sent a questionnaire that asks whether or not they've taken the Security and Privacy training course, questions if they're aware that only the main entrance is to be used on weekends, and gives them the option to provide a reason for using an unauthorized entrance.
Process
Help topic Creating questionnaires
First, you create a Facility Access Policy Review Questionnaire.
Then, since you have a column with the employees' email address, you create a trigger to automatically email employees the questionnaire whenever an unauthorized access issue is Open.
Result
The questionnaire will be sent when the conditions are met, and you can gather additional information from respondents to contextualize your data.
3. Visualize data
Data visualizations are essential to helping people understand the story within the data. Placing the data in a visual context helps patterns, trends, and correlations emerge that might otherwise go unnoticed. Data trends and patterns are best demonstrated in the context of larger goals and metrics. By presenting your data visualizations within context, a better story emerges from your data and stakeholders can draw clearer conclusions.
Create a visualization
A visualization is a graphic representation of the results within a table. Once you understand your audience and your data, you can visualize data using the chart type that best expresses the story in the data.
Example
Scenario
Now that you've automated the workflow, you're ready to analyze your results and share your findings. You also want to perform an outlier analysis.
As you review your notes from a previous audit planning meeting, you notice the following bullet point:
- Aug 22 - employees working 911 project
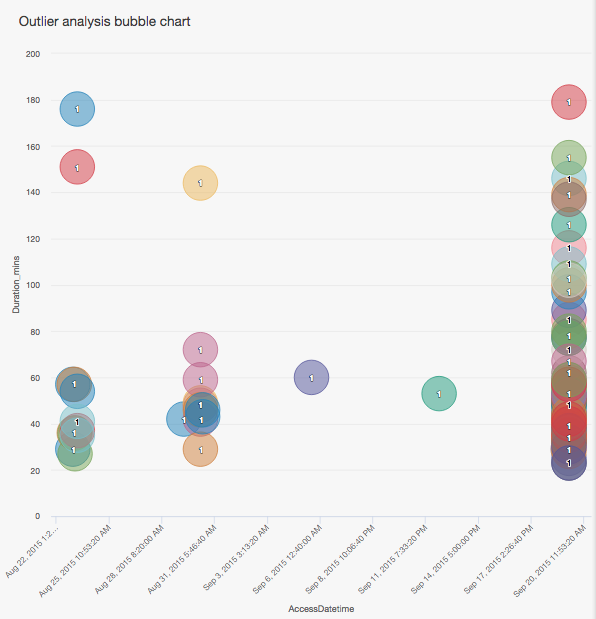
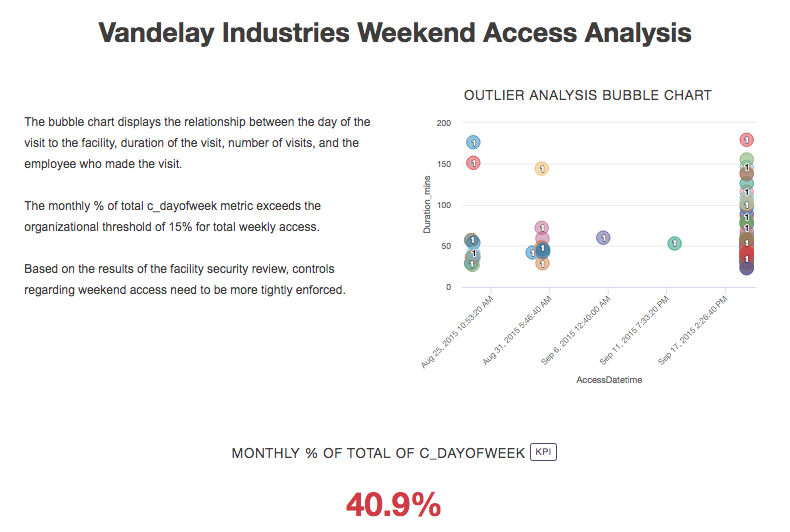
Given the number of employees and departments involved, it's likely that additional access points were opened up on August 22, but this wasn't confirmed in the documentation. A bubble chart could help you visually inspect the issues to identify outliers worth further scrutiny as well as identify potential false positives that match the 911 project date.
Process
Help topic Visualizing table data in charts
You create a bubble chart that displays the relationship between the day of the visit to the facility, duration of the visit, number of visits, and the employee who made the visit. You also filter out access entries from August 22 since they're likely to have occurred when multiple entrances were opened to help facilitate the 911 project.
Result
You are able to visualize and summarize your analysis.
Track key indicators with metrics
Metrics monitor the data in a single column over a time period using an aggregate function such as average, count, or percentage of total. When you configure a metric, you also set triggers with threshold conditions that test the value of the calculation. When any of these conditions evaluate to true, the trigger's calculation value changes and any associated actions execute.
Example
Scenario
Now that you have created a visualization that shows facility access issues, you also want to be able to monitor the total percent of weekend access as compared to overall weekly access.
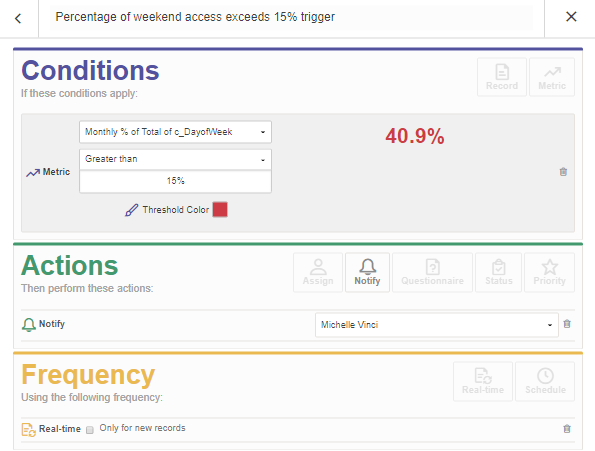
Vandelay Industries has set a threshold for weekend access at 15% of total weekly access. As part of your duties, you must monitor and report any months where the percent of weekend access exceeds 15%.
Process
Help topics
First, you create a new data analytic called Weekday and Weekend Access 2016 Q1, and you upload an access logs Excel file to the data analytic.
Then, you create a metric to monitor the total percent of weekend facility access. Finally, you create a trigger that will notify you when the percent of weekend access exceeds 15%.
Result
The metric and trigger configuration is saved. The trigger notifies the appropriate person when the metric threshold is exceeded.
4. Present a data story
Using the results of attestation projects and incident management root cause analyses, organizations can identify gaps or weaknesses in existing policies. They can also provide feedback to policy writers to develop new policies or strengthen existing ones. Auditors can use Results to create a compelling storyboard and track KPIs/KRIs, which can be quickly consumed and acted on. Once created, reports can be shared with the appropriate stakeholders.
Create a storyboard
Storyboards provide a macro view over a larger collection of similar incidents in order to determine trends and analyze the root cause of systemic issues. For frequently recurring incidents, storyboards can be used to report on the incidents portfolio as a whole.
Example
Scenario
Based on the results of your review, and the visualization and metric you created, you feel that controls regarding weekend access need to be more tightly enforced. You want to pull your analysis together into a storyboard to tell the security review story, and use the data to convince your manager to implement more control enforcement.
Process
Help topics
First, you create a storyboard, and include the visualization and metric you previously created in your storyboard. Then, you share the storyboard with the appropriate stakeholders.
Result
The storyboard displays multiple visualizations and text content in a single communication platform. Managers and other stakeholders can use this information to detect patterns or trends, analyze the root cause of system issues, and develop more efficient and effective business processes.
Link Results data to your assessments in Projects
During any assessment phase, you can link Results data to support your documentation in Projects. By linking Results data, you can highlight exceptions or important information that pertains to a control failure, and reduce subjectivity in risk assessments.
Example
Scenario
Now that you have analyzed the access logs, you can finish executing procedure 3-02:
3-02: On weekends, only the main entrances of facilities (South 1 in Denver (DV1)) and South 2 in Los Angeles (LA1)) are to permit key card entry.
You want to add the supporting evidence from Results to your assessment in the Projects app to consolidate information, and easily sign-off when remediation is complete.
Process
Help topic Linking evidence from Results
In Projects, you navigate to the appropriate procedure, and link the Results data to support your documentation:
You then create an issue for the exceptions identified in the data analytic to help you manage an issue remediation plan. Finally, you sign-off on your work and have your manager approve it.
Result
The Results data is consolidated and linked to your Projects documentation. Now, you can easily review the exception data, and validate whether or not the issue has been truly remediated.
What's next?
Learn how to report your audit
Audit teams can use the Projects and Reports apps to generate reports.
To find out more, see Reporting your audit.
Enroll in an Academy course
Continue to build your knowledge on the concepts introduced in this article by taking the PROJ 100 learning path.
Academy is Diligent's online training resource center. Academy courses are included at no extra cost for any user with a Diligent One subscription. For more information, see Academy.