Reporting on time usage
Timesheets is an app in Diligent One. You can use the Timesheets app to report on time usage within a single project or across all projects in the Diligent One instance.
How it works
Using the Time Report page, you can generate reports to visually track time usage across all employees and view the overall resource utilization across your organization. You can apply filters to restrict the data in the report to particular employees, tasks, and time periods.
Once you generate a report, you can export it to .pdf or .xlsx to share with other stakeholders.
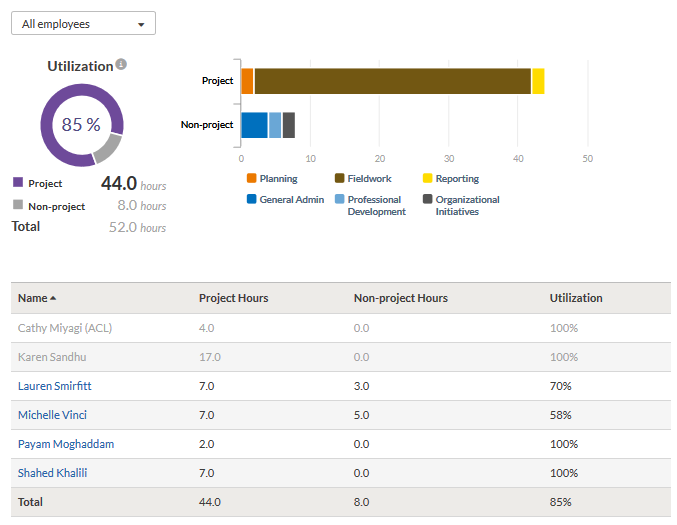
Utilization chart
Once you select a time period to report on, the Time Report page displays a Utilization chart.
The chart shows:
- data based on the date and employee filters applied
- an aggregate count of project and non-project hours
- the total number of project and non-project hours
The utilization percentage is calculated by the number of hours spent on a project divided by the total hours recorded for a specified time period.
Bar chart
The bar chart on the Time Report page provides the ability to view the number of hours spent on specific project or non-project tasks, and drill into details for a particular project or non-project task.
Clicking on a bar filters the view and shows:
- all employees that entered hours for the project or non-project task
- the number of hours entered per employee based on the project or non-project task
Table
You can view a summary of time usage per employee by viewing the table on the Time Report page.
The table provides the following information per employee:
- the total number of project hours spent
- the total number of non-project hours spent
- the total utilization percentage for the specified time period
Example
Reporting on time usage
Scenario
As a Senior Manager, you are responsible for creating and maintaining a master audit schedule and time budget. You need to confirm how much time all audit team members have spent over a period of two weeks to ensure all required audit activities were efficiently accomplished.
Process
You navigate to the Time Report page and select the time period that the report should be based on.
Result
The time usage report is generated:
Permissions
Professional Managers, Professional Users, and Oversight Executives can view reports. Professional Managers, Professional Users, and Oversight Executives that have been assigned the Timesheets Admin privilege can view and filter all time entries, and view reports.
Report on time usage across all projects
Report on time usage across all projects within the Diligent One instance.
Navigate to the Time Report tab
-
From the Platform home page (www.diligentoneplatform.com), select the Timesheets app to open it.
If you are already in Diligent One, you can use the left-hand navigation menu to switch to the Timesheets app.
Note
Diligent One Platform also supports the domain www.highbond.com. For more information, see Supported domains.
- Click the Time Report tab.
The Time Report page opens and displays the current week, based on the time zone set in your user profile.
Specify a time reporting period
- Click the date range to define a specific time period.
- Click Apply.
The maximum date range for selection is 2 years. Time entries are filtered for the specified time period. The date format displays according to the date format specified in your user profile.
NoteThe specified time period must include previously recorded time entries.
Sort information
Click any of the headings in the table header to sort by:
- employee names alphabetically (ascending or descending order)
- project hours
- non-project hours
- utilization
Result The table is paginated and shows a maximum of 20 employees at a time.
View detailed time usage per employee
- Do one of the following:
- From the All employees dropdown list, search for and select the appropriate person.
- From the table, click the name of the person.
- Complete any of the following actions:
- View the Utilization chart to see the employee's productivity, including the number of project and non-project hours.
- Use the Project Hours and Non-project Hours tabs on the table to view individual time entries entered under each category.
- Use the bar chart to filter for Project or Non-project related tasks.
Generate a time report
Complete any of the following actions:
- To generate a PDF report, click Time Reporting (PDF Format).
- To generate an Excel report, click Time Reporting (Excel Format).
Result Any filters applied (employees or specified dates) are reflected in the report.
Report on time usage for a single project
View how many hours budgeted for a single project have been used and download a time usage report.
-
From the Platform home home page (www.diligentoneplatform.com), select the Projects app to open it.
If you are already in Diligent One, you can use the left-hand navigation menu to switch to the Projects app.
Note
Diligent One Platform also supports the domain www.highbond.com. For more information, see Supported domains.
The Projects home page opens.
- Open a project.
The project dashboard opens.
- Click the Timesheets project management tab.
The Time & Budget Tracking page opens.
- Do any of the following:
- To view the Time Usage Breakdown chart, click Show Time Charts.
You can use the dropdown lists to apply filters to view time usage within a specific date range or by person, or you can hover your mouse over the colored section of the chart to reveal the hours spent on each category.
- To update the budgeted hours for the project, click Update.
You are redirected to the Project Settings page where you can update budgeted hours in addition to other project settings.
- To download a time usage report, click the PDF or Excel report under the Time entries side panel.
- To view the Time Usage Breakdown chart, click Show Time Charts.
Chart categories
The Time Usage Breakdown chart on the Time & Budget Tracking page has four categories:
| Category | Description |
|---|---|
| Administrative | Administrative time added from the Timesheet project management tab via Add Administrative Time. |
| ObjectiveName | Time entries added from the Time entries side panel. |
| Project Management | Time entries that are associated with Planning files and Results files. |
| Issue Management | Time entries that are associated with Issues. |