Creating multi-chart canvases
In the Reports app, a multi-chart canvas is a presentation platform that allows you to display a table, multiple charts, images, and rich text content together.
How it works
You can create a multi-chart canvas to display related information on a single page. Multi-chart canvases can be displayed in reports, or added to dashboards and presents.
Example
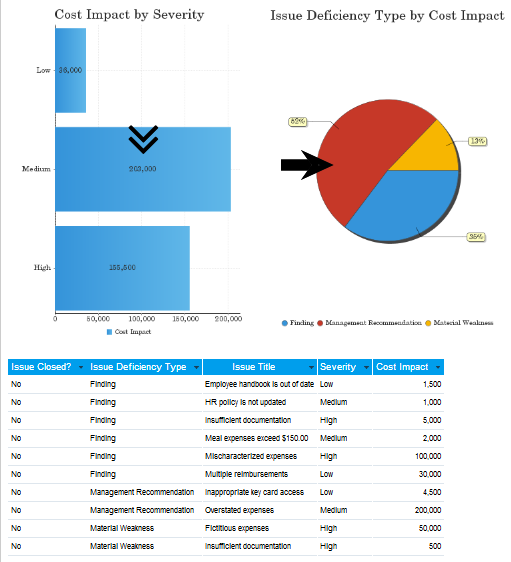
Multi-chart canvas showing summary and detailed issues data
Scenario
You want to present summary and detailed issues data to your relevant stakeholders. The report needs to include a couple of visualizations to show information at a high level, and a table where detailed information can be viewed.
Process
You define the fields in your report and create two related visualizations. From the Design tab, you configure your presentation by adding the charts as widgets, and adding a few shape widgets to highlight important information. You then save and activate the report.
Result
Before you start
To create a multi-chart canvas, you must first create a report and add at least two charts to the report.
For more information, see Creating reports and Visualizing report data using charts.
Permissions
Only Report Admins and Report Writers can create a multi-chart canvas.
Create a multi-chart canvas
-
From the Platform home page (www.highbond.com), select the Reports app to open it.
If you are already in Diligent One, you can use the left-hand navigation menu to switch to the Reports app.
- Open the appropriate report and click Edit > Design.
The report opens.
- Design your multi-chart canvas by selecting any of the following options, and dragging the widgets into the canvas space:
Option Description 
Chart Widgets
includes charts you have added to the report in your multi-chart canvas
You can drag charts indicated with the plus icon
 .
. Charts that have already been added to the multi-chart canvas are indicated with the checkmark
 .
.
Text Widgets
includes text boxes in your multi-chart canvas

Graphics Widgets
includes graphical elements you can use to highlight key information in your multi-chart canvas 
Image Widgets
includes preexisting images or new images added through the Image Manager - To configure properties of a specific widget, click the widget and configure any settings in the Properties panel.Tip
If you need to make a change to your chart, hover over the chart widget and in the upper-right corner, click Transform
 > Edit Chart.
 - To adjust the layering of widgets, hover over the widget and in the upper-right corner, click Transform > Arrange.
- To delete a widget from the canvas, hover over the widget and in the upper-right corner, click Transform > Delete.
- To adjust the size of a widget, click and drag the arrow
 in the lower-right corner of the widget.
 - To adjust the position of a widget, drag it anywhere within the canvas space.
- To re-size the canvas, drag the arrow in the lower-right corner of the canvas space.
The canvas indicates the standard width and height for dashboards and presents. This allows you to control the sizing of the canvas in relation to where the canvas will ultimately be displayed.
TipUse the Canvas Properties panel to configure the chart canvas.
Save the report
- Click the Publish tab.
The Save Report dialog box opens.
- In the Details tab:
- Enter a name and description for the report.
- Define where the report will be stored by selecting the appropriate content folder and content sub folder.
- Optional. Click + Add tags to create tags that classify the report, or select any existing tags to associated with the report.Tip
You can use tags to quickly filter reports on the Browse page.
- Specify the access level required for the report:
- Public all users that have access to the content sub folder the report is stored in will have access to the report
- Private allows you to define specific people and / or groups that can access the report
The User Access tab displays, and allows you to define the people / groups that can access the report.
- In the Distribution tab, specify how the report can be distributed:
- Broadcast allows you to broadcast the report to yourself or other people by email
- Email allows you to distribute the report by email
- Email & Broadcast Security if Broadcast or Email is selected, this option allows you to specify the level of access required for people to be able to receive the report by email
- All Users all Reports users can receive the report via email
- Unsecure the report can be sent to external stakeholders that do not have access to the Reports app
- Validated Users all users with folder access to the dashboard tab can receive the report via email
NoteThe Web Services option is currently not supported.
- In the Export tab, specify the settings for the export options:
- Default use the default settings defined in the report configuration
- On turn on the export option
- Off turn off the export option
- In the Report Settings tab, specify if the report can be made visible on the Browse page, and if the report can be added to dashboards.
- Save the report as a draft or activate the report to make it available to other people:
- Save > Activate saves the report and makes it available to users with the appropriate access
Once you activate a report, you can email the report, and add the report to a dashboard or presentation.
NoteIf User Access settings in the sub folder have been set to Expert approval required to publish, select Save > Request Approval.
- Save > Draft saves the report and does not make it available to users assigned the Report Writer or Report Reader role
- Save > Activate saves the report and makes it available to users with the appropriate access