Remediating and reporting exceptions
Simply identifying exceptions in data doesn't mean you have solved the problem. If you are spending much of your time chasing down people to remediate, root issues will still persist. To be efficient, organizations need the ability to automate exception remediation and monitoring, and present a data story that mobilizes action to better manage risk. In this article, we discuss how to automate a remediation workflow and visualize data using the Results app.
This article builds on the examples illustrated in Scripting to automate a business process and Scheduling an analysis.
What does it mean to remediate and report exceptions?
Remediating exceptions involves identifying and managing red flags and gathering information from respondents to contextualize data. Reporting exceptions includes visualizing data to highlight trends, patterns, or outliers.
Where do I remediate and report exceptions?
You can remediate and report exceptions using the Results app.
The big picture
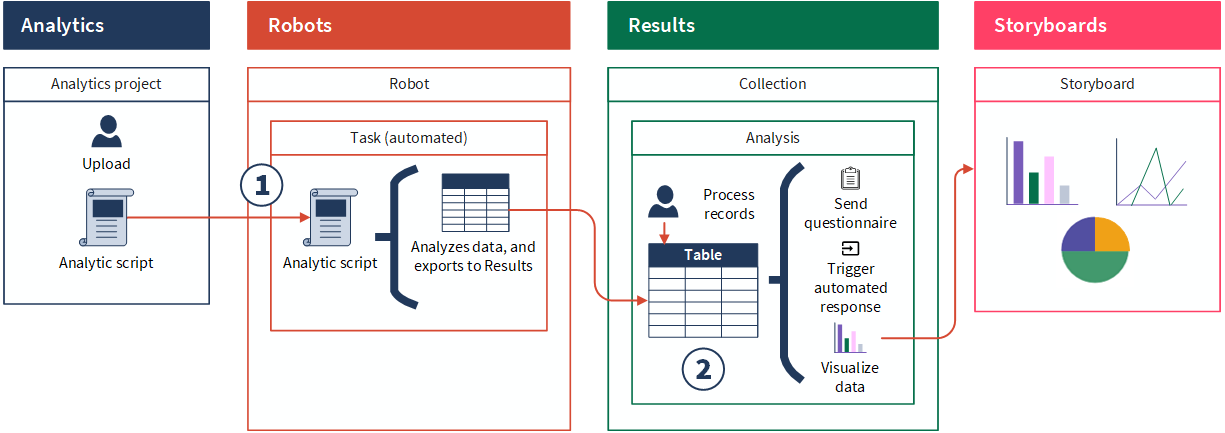
![]() You can take an analytic script that you created in Analytics, and upload it to Robots to run the script on an automated basis. A robot can perform a task to execute an analysis and export exception data to Results.
You can take an analytic script that you created in Analytics, and upload it to Robots to run the script on an automated basis. A robot can perform a task to execute an analysis and export exception data to Results.
![]() In Results, you can automate a remediation workflow using questionnaires and triggers. Then, you can use Storyboards to visualize data:
In Results, you can automate a remediation workflow using questionnaires and triggers. Then, you can use Storyboards to visualize data:
- Questionnaires are used to contextualize data and responses are stored in tables.
- Triggers automate your organization's remediation workflow by executing a set of actions based on record data in tables or metric thresholds you define.
- Storyboards present data results using multiple visualizations, which is based on record data in Results tables.
Steps
Ready for a tour?
Let's take a closer look at these features in context.
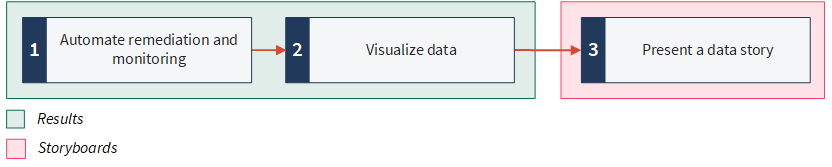
1. Automate remediation and monitoring
Results helps you automate your organization's remediation workflow when investigating potential issues. Using a combination of questionnaires and triggers, you can manage a large number of potential issues, and identify and prioritize those which need immediate attention.
Set up an environment for processing records
Each table in Results includes a default view for processing records. You can also create additional views of the data in the underlying source table. This allows you to organize and isolate data based on different dimensions or categories, and present other users with a pre-configured view that they can use to process records.
Example
Scenario
You want the person reviewing exceptions to have all the information necessary to make appropriate decisions. You also want certain transaction red flags to be immediately visible to them as they review exceptions.
Process
Help topic Viewing table data
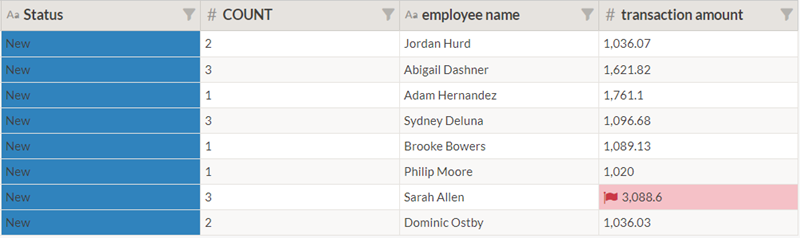
First, you open the Employees over monthly limit table in Results, and configure the table view to display the following fields:
- Status
- COUNT
- employee name
- transaction amount
Then, you apply conditional formatting to the Status and transaction amount columns. Finally, you save the view and call it Employee Pcard violations.
Result
You have set up a pre-configured view that other users can access when processing records:
Create questionnaires
Questionnaires are used to gather information from respondents and contextualize data. Each collection can have one or more questionnaires that you deploy as follow-up mechanisms when remediating records. Responses are captured in the specified table with each question defined as a distinct column.
Tip
The Template Questionnaires Collection contains a variety of pre-built questionnaires that you copy and use as a starting point. Each template questionnaire relates to different industry segments and is pre-populated with a series of questions.
Example
Scenario
Currently, exception data is exported from Analytics to Results on an automated monthly schedule. You need a way to tell the finance manager in your organization that new exceptions are available to review. The finance manager can then decide whether or not additional follow-up is required.
If the finance manager decides an exception requires follow-up, a questionnaire should be sent to the appropriate employee, requesting further information about the transactions that put them over their monthly limit.
Process
Help topicCreating questionnaires
You create two questionnaires:
- Pcard exception review sent to Vandelay's financial manager to facilitate the initial investigation process
- Pcard follow-up sent to employees if the finance manager decides that further investigation is required
Pcard exception review
| Question | Response type | Column name |
|---|---|---|
| After your review, does this exception require further investigation? | Single choice | Further_investigation |
Pcard follow-up
| Question | Response type | Column name |
|---|---|---|
| Confirm you have read Vandelay's Procurement Card Policy and understand the section on monthly transaction limits. | Single choice
(Yes / No) |
Policy_attestation |
| Under what circumstances were these Pcard transactions made? | Paragraph | Circumstances |
| Did your manager pre-approve these transactions? We will follow up with them to confirm. | Single choice
(Yes / No) |
Manager_approval |
| Attach supporting documentation here: | Attachment | Supporting_documentation |
Result
The questions you added to the two newly created questionnaires display as distinct columns in the Employees over monthly limit table. When people respond to the questionnaires, their responses are saved alongside the original record information.
Create triggers
You can create triggers to automate your organization's workflow by defining a set of actions that automatically execute when a specific change occurs. Triggers are associated with individual tables and can be configured for record changes or metrics thresholds.
Example
Scenario
You want to automate the following remediation workflow:
- The finance manager receives a questionnaire (Pcard exception review) that prompts them to review new exceptions and decide if additional follow-up is required.
- If the finance manager decides an exception requires follow-up, a questionnaire (Pcard follow-up) should be sent to the appropriate employee, requesting further information about the transactions that put them over their monthly limit.
- If no response is received in seven days, the questionnaire (Pcard follow-up) should be sent to the employee again.
- When an employee submits their questionnaire Pcard follow-up, the finance manager should be notified.
Process
Help topicCreate a trigger
You create the following triggers:
| Trigger name | Conditions | Actions |
|---|---|---|
| Send Pcard exception review questionnaire to finance manager |
|
|
| Close investigation of the Pcard exception |
|
|
| Send Pcard follow-up questionnaire to employee |
|
|
| Resend Pcard follow-up to employee after seven days of no response |
|
|
| Notify finance manager when employee submits questionnaire |
|
|
Result
The triggers are set up to notify and send questionnaires to the appropriate people and update record statuses when the conditions are met. The actions are automated and the entire workflow is managed through Results — with no external systems or bottlenecks to contend with.
Track key indicators with metrics
Metrics monitor the data in a single column over a time period using an aggregate function such as average, count, or percentage of total. When you configure a metric, you also set triggers with threshold conditions that test the value of the calculation. When any of these conditions evaluate to true, the trigger's calculation value changes and any associated actions execute.
Example
Scenario
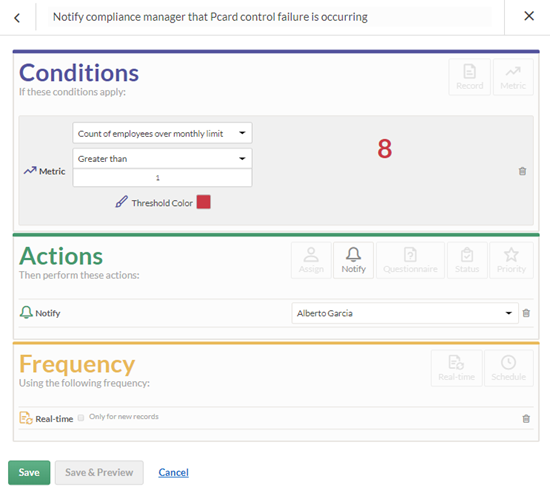
Now that you have some experience creating triggers, you're interested to see if you can create a trigger to track indicators of control failure in an automated way. If Pcard controls are failing, you want to be able to notify the appropriate stakeholder.
Process
Help topics
First, you create a metric called Count employees over monthly limit. Then, you add a trigger to notify the compliance manager when the count of the metric is greater than 0:
Result
The metric and trigger configuration is saved. The trigger notifies the compliance manager to investigate when the metric threshold is exceeded, which indicates that the control is failing.
2. Visualize data
Data visualizations are essential to helping people understand the story within the data. Placing the data in a visual context helps patterns, trends, and correlations emerge that might otherwise go unnoticed. Data trends and patterns are best demonstrated in the context of larger goals and metrics. By presenting data visualizations within context, a better story emerges from data and stakeholders can draw clearer conclusions.
Example
Scenario
Now that you have automated the remediation workflow for exceptions, you are ready to analyze results and share findings with key stakeholders.
Process
Help topic Visualizing table data in charts
You create the following visualizations:
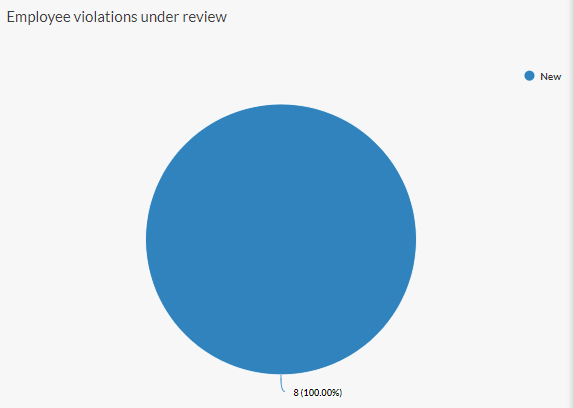
- Employee violations under review (Pie chart) provides visibility into the status of Pcard exceptions
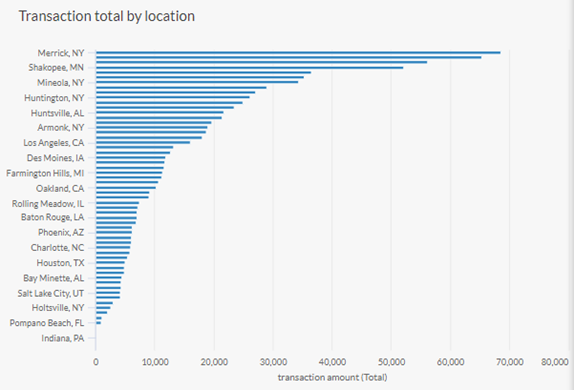
- Transaction total by location (Stacked bar chart) provides visibility into Pcard spending by location
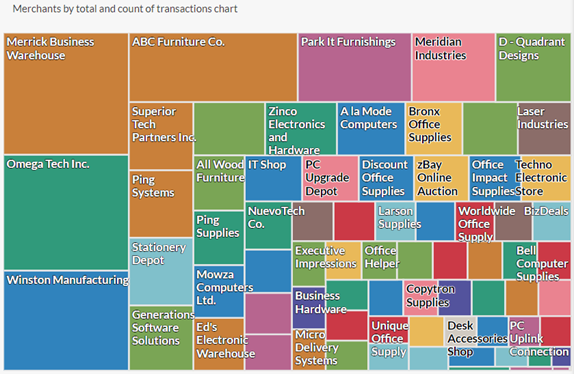
- Merchants by total and count of transactions chart (Treemap) provides visibility into Pcard transaction spending by merchant
Result
You are able to visualize and summarize the analysis using three charts:
| Pie chart | Stacked bar chart | Treemap |
|---|---|---|
|
|
|
3. Present a data story
Storyboards provide a macro view over a larger collection of similar incidents in order to determine trends and analyze the root cause of systemic issues. For frequently recurring incidents, storyboards can be used to report on the incidents portfolio as a whole.
Example
Scenario
You have been busy creating visualizations and metrics to communicate the Pcard program exceptions. Now, you want to pull the analysis together into a storyboard to tell the data story.
You need a way to share findings with all the necessary people across your organization. Sharing this information with Pcard program and compliance stakeholders is critical, but not everyone in your organization has access to Results.
Process
Help topics
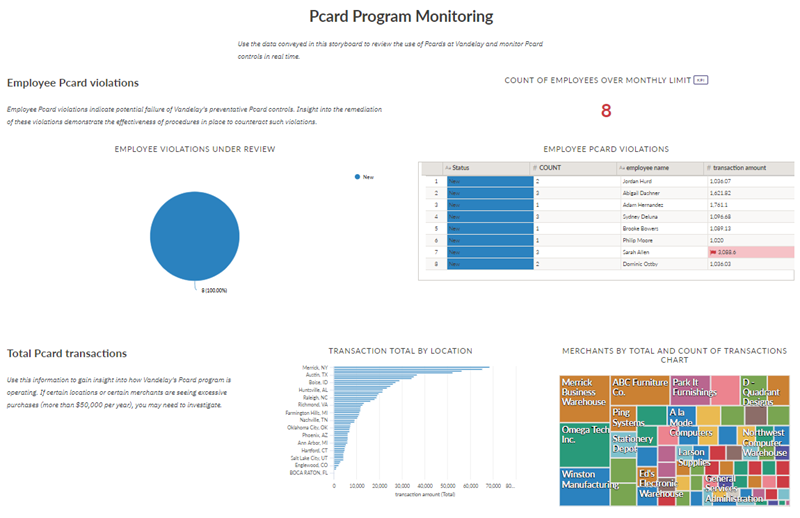
First, you create a storyboard, and include the table view, metric, and charts you previously created in the storyboard. Then, you share an anonymous link to the storyboard with the appropriate stakeholders.
Result
The storyboard displays multiple visualizations and text content in a single, communication platform. Managers and other stakeholders can use this information to detect patterns or trends, analyze the root cause of system issues, and develop more efficient and effective business processes.
What's next?
Enroll in an Academy course
Continue to build your knowledge on the concepts introduced in this article by taking the ACL 270 learning path.
Academy is Diligent's online training resource center. Academy courses are included at no extra cost for any user with a Diligent One subscription. For more information, see Academy.