Continuous reporting and monitoring of strategic risks is a dynamic process that requires organization-wide participation. To be effective, the ERM function needs to address critical trends before they become major problems, and periodically report on risk to key stakeholders. In this article, we discuss how to report and monitor risk using the Strategy, Projects, and Results apps.
This article builds on the examples illustrated in Implementing enterprise risk management.
What's involved in reporting and monitoring risk?
Reporting risk is the process of communicating real-time risk and performance data to different stakeholders.
Monitoring risk is a continuous activity that results in the awareness of what is actually happening across different parts of the organization. Over time, monitoring risk enables management to:
- identify critical trends
- respond in an appropriate and efficient manner
- spot business opportunities or process improvements that would otherwise not have been apparent without effective monitoring in place
Where do I report and monitor risk?
At Diligent, we use a combination of the Strategy, Projects, and Results apps to monitor and report risk. Our ERM program enables us to align on our values, vision, and valuation, accelerate our growth agenda in our go-to-market capability and product innovation, and ensure we always deliver the best experience to our customers.
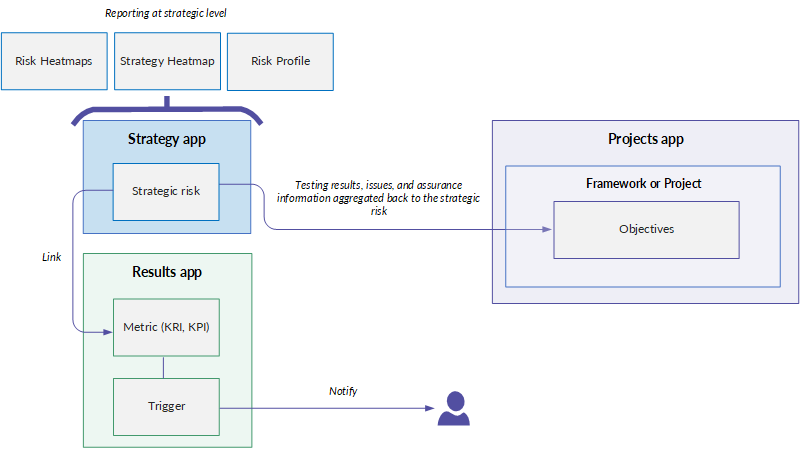
The big picture
- Risk Heatmaps, the Strategy Heatmap, and the Risk Profile can be generated at anytime and shared with a variety of stakeholders for reporting purposes.
- Testing Results and Assurance scores can be rolled up from Projects to the strategic risk assessment in Strategy for reporting purposes, providing the ability to view a dashboard of risk and project outcomes at the strategic level.
- Metrics can be linked to strategic risks to track and monitor risk, and Triggers can be used in combination with metrics to notify key stakeholders and drive real-time decision-making.
Assurance for risk can be reported on at an aggregate or granular level, depending on the needs of the audience. Risk can be monitored continuously and automatically by integrating Results metric data, enabling management and the board to make faster, risk-quantified decisions.
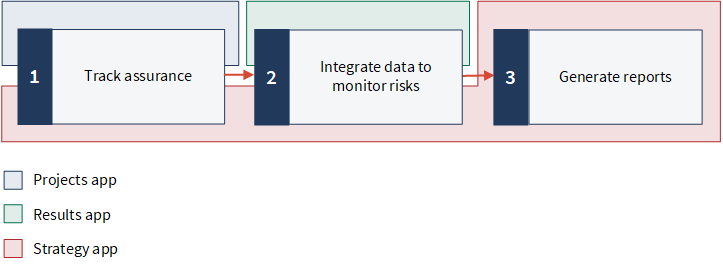
Steps
Ready for a tour?
Let's take a closer look at these features in context.
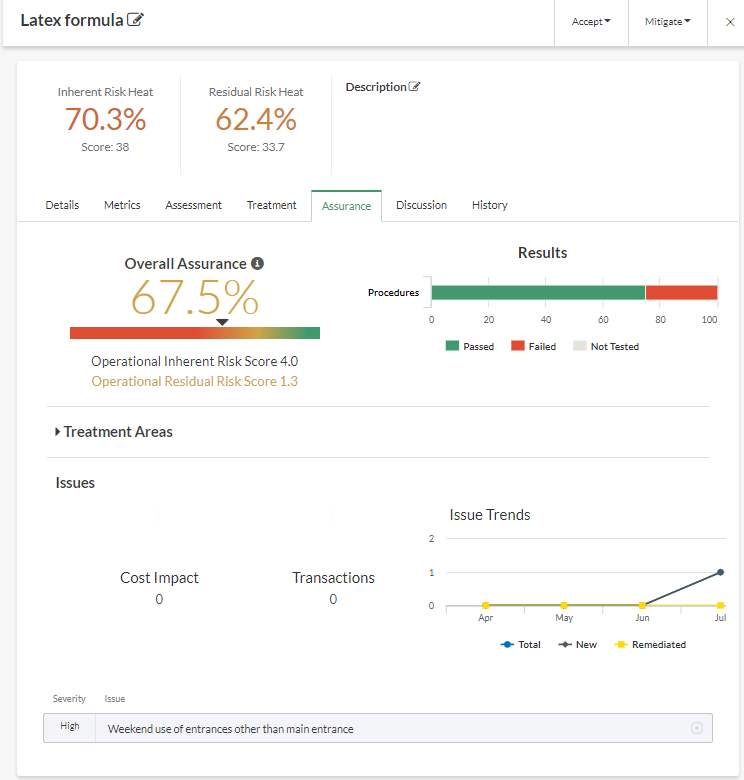
1. Track assurance
Assurance is a calculation-based process in Projects that can be rolled up to Strategy, with the final result that is represented by a value (a percentage). Assurance allows you to benchmark how well an organization is doing in mitigating risk so that resources can be allocated appropriately. Once the preliminary treatment evaluation is complete, assurance teams can test controls, and risk management teams can view aggregated assurance scores and associated testing results across the different treatments areas.
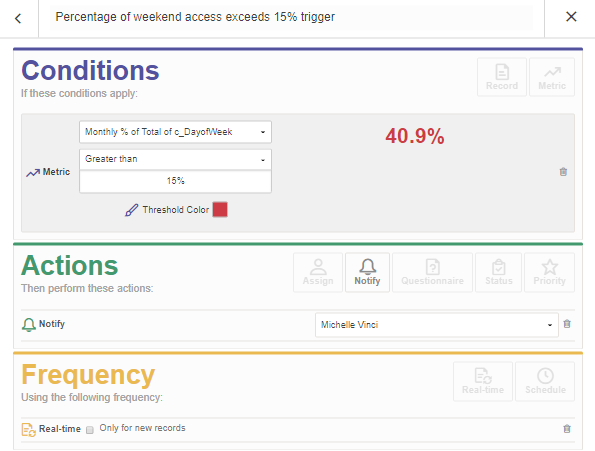
2. Integrate data to monitor risks
To continuously monitor risk and drive real-time action, you can link a metric in Results to a strategic risk in Strategy. Metrics monitor the data in a single column over a time period using an aggregate function such as average, count, or percentage of total. When you create a metric, you also set triggers with threshold conditions that test the value of the calculation. When any of these conditions evaluate to true, the trigger's calculation value changes and any associated actions, such as notifying key stakeholders, are taken.
Tip
To avoid manually scoring strategic risks, you can use Assessment Drivers to automate different risk assessments. You can link a metric created in the Results app to a risk assessment in Strategy in order to inform the assessment, and auto-populate inherent risk scores based on pre-defined metric ranges. Key stakeholders can be notified when changes to the risk assessment occur.
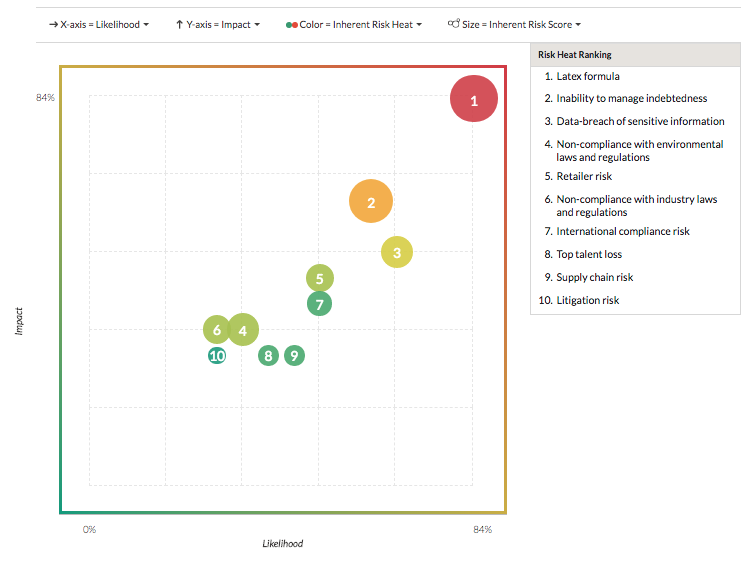
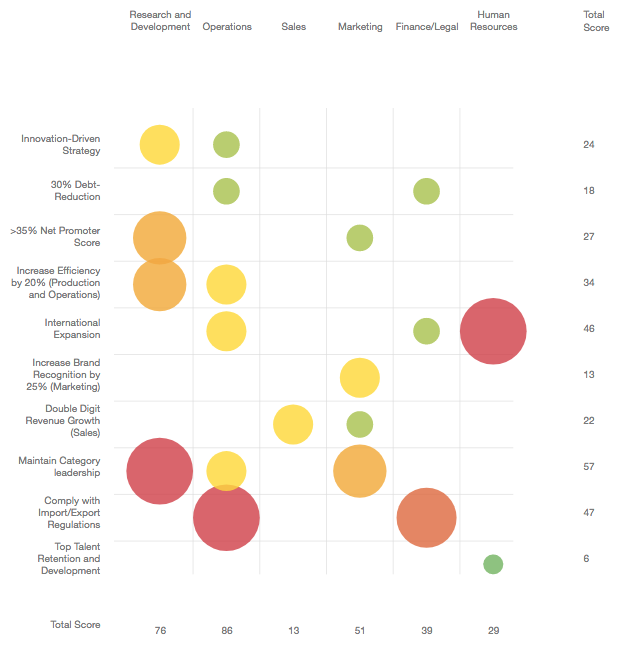
3. Generate reports
In Strategy, you can create comprehensive and configurable risk heatmaps to share with management and the board, which can be quickly consumed and acted on. Once created, risk heatmaps can be exported and shared electronically. Other default reports, such as the Strategy Heatmap, that identifies the relative severity and aggregation of risk across different parts of the organization, can also be downloaded at anytime. Risk management teams can additionally extract detailed risk profile information by downloading the available Excel report.
Tip
There are a variety of reporting capabilities in other Diligent One apps that can be used for reporting on risk. For example, the Storyboards app can be used to report on the state of cybersecurity, present a supplier risk and performance scorecard, report on policy management, or showcase revenue growth financial updates.
What's next?
Enroll in an Academy course
Continue to build your knowledge on the concepts introduced in this article by taking the STRAT 100 learning path.
Academy is Diligent's online training resource center. Academy courses are included at no extra cost for any user with a Diligent One subscription. For more information, see Academy.
