Organizing data in Results
Results is an app in Diligent One. You can use the Results app to organize, track, and remediate issues. This beginner's quick start walks you through the process of setting up a Collection and importing data from a spreadsheet.
Before you start
Before you start, you must:
- be assigned an appropriate subscription and Results role
- prepare an Excel (.xlsx) or CSV (.csv) file to import data from, or use the sample Excel file provided
Set up a container for your data
There are three levels of organization for data: Collections, Analyses, and Tables. Data is stored in tables, and each table is contained within an Analysis and a Collection.
Create a Collection
-
From the Platform home page (www.diligentoneplatform.com), select the Results app to open it.
If you are already in Diligent One, you can use the left-hand navigation menu to switch to the Results app.
Note
Diligent One Platform also supports the domain www.highbond.com. For more information, see Supported domains.
- From the Results home page, click Add Collection.
- On the New Collection page, enter a name and description for the collection.
- Click Create Collection.
Result The Collection Settings page opens and you can see the list of members who have access to the new Collection.
Create an Analysis
- At the bottom of the Collection Settings page, under What's Next?, click create your first Data Analysis.
- On the Analysis Details page, enter a name and description for the analysis.
- Click Create Analysis.
Result The Collection opens and you can see the new empty Analysis that you created.
Create a Data Analytic table
- On the Analysis, select Add Table > Data Analytic.
- On the Data Analytic Details page, enter a name and description for the Data Analytic.
- Click Create.
Result The table is created and the Import Data page opens.
Import your data into the Data Analytic
Once you create a Data Analytic, you can import records into it using a data file or Analytics. When importing, you specify the data type for each field, and then confirm your import.
- On the Import Data page, click Choose files, browse to the .csv or .xlsx file that you want to upload, and then click Open.
-
Using the lists above each column in the import preview, verify that the data type of each field is correct and select alternative types if required.
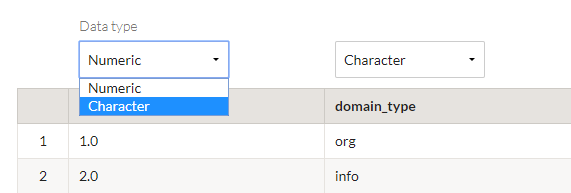
- To finalize the import, at the bottom of the page, click Confirm Data Types.
Result The data is imported and the table opens in the Table View. The imported records are shown and are ready to be processed.
Process a record in the Data Analytic
Results adds information columns to the records you import to help you track and remediate issues. Information columns contain metadata that describes the status, priority, and assignee of a record. When you process a record, you update one or more of these information columns.
- To display the information columns, in the upper-right corner of the Table View:
- Click Configure
 .
. - On the Configure Table View panel, click the All toggle.
- At the bottom of the panel, click Apply.
- To dismiss the panel, in the upper-right corner of the panel, click the X.
The information columns are now visible.
- Click Configure
- In the first record in the table, click the checkbox and at the top of the table.
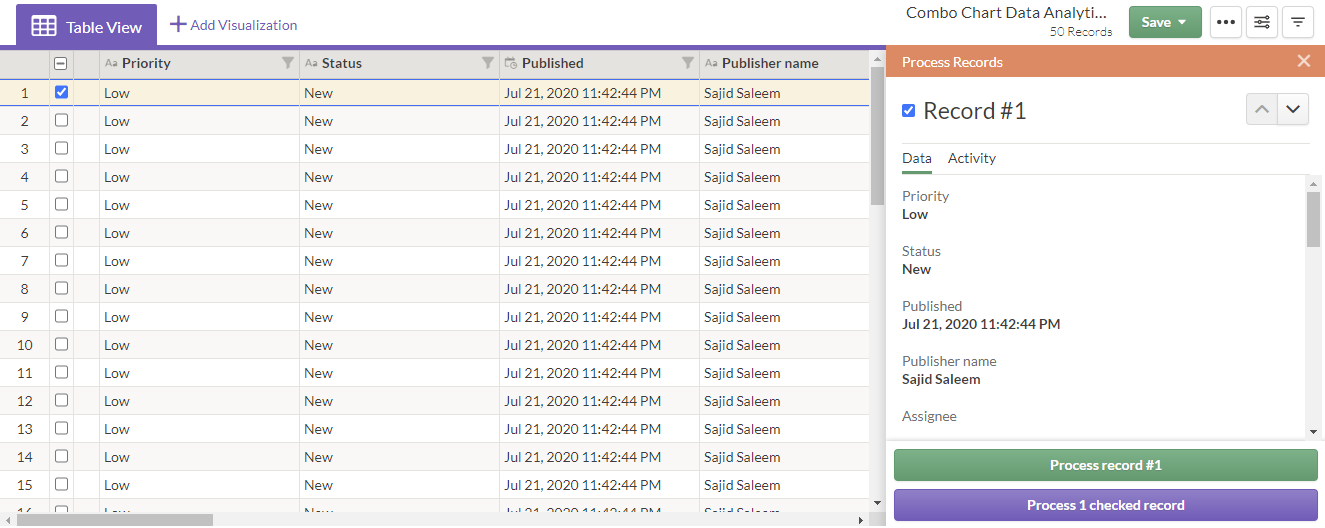
- In the Process Records panel, click Process record #1.
- From the Priority list, select a new priority and click Process #1.
- To close the panel, in the upper-right corner, click the X.
Result the record is updated and reflects the priority you selected. The Updated field shows the date and time that the change was made to the record.
Next steps
Now that you have completed the basic workflow of setting up Results and importing data to be processed, you can explore advanced features and functionality:
| Feature | Description | More help |
|---|---|---|
| Visualizations | Create charts so that you can visualize the imported data. | Interpretations and visualizations |
| Triggers | Add triggers to automate your record processing workflow. | Triggering automated activity |
| Metrics | Define metrics to track key indicators and drive risk assessments. | Monitoring key indicators with metrics |
| Questionnaires | Gather questionnaire responses to supplement record information. | Gathering responses from questionnaires |
| Storyboards | Results is closely linked to the Storyboards app. Use Storyboards to present visualizations on storyboards and report on trends and patterns in the data. | Overview of Storyboards |